With Stocks The Most Overvalued In History, Goldman Lists The 4 Biggest Risks
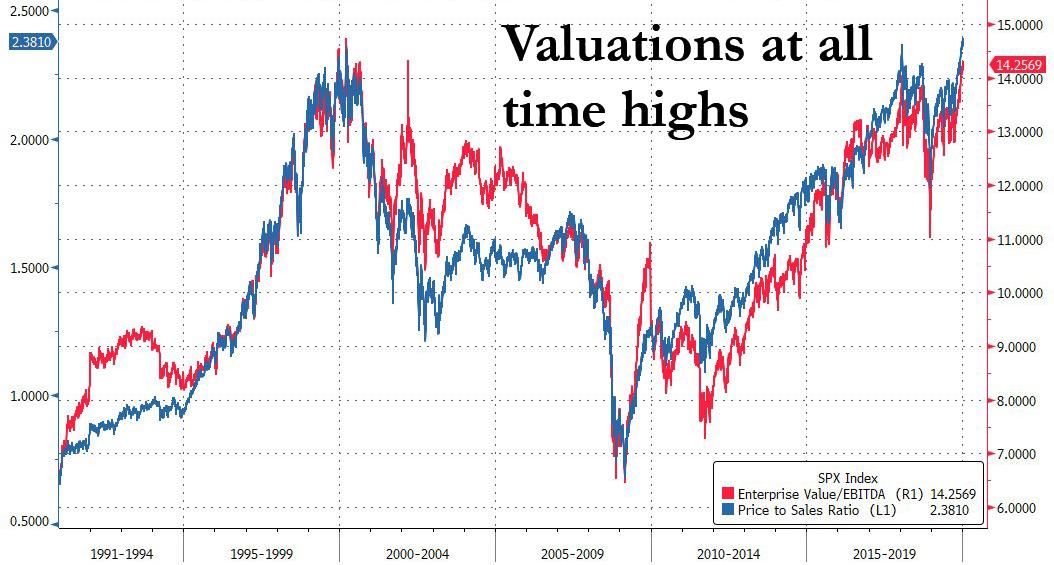
With the S&P meltup accelerating into the first full week of the new year, Friday's modest pullback on the subpar December jobs report notwithstanding, sellside strategists are tripping over themselves to come up with even more reasons to justify the risk surge higher despite S&P valuations (price to sales and EV/EBITDA) which are now at all time highs, surpassing the prior dot com peak (which prompted Bloomberg to write "S&P 500 Bulls Make Peace With Valuations at 2018 Meltdown Levels")...
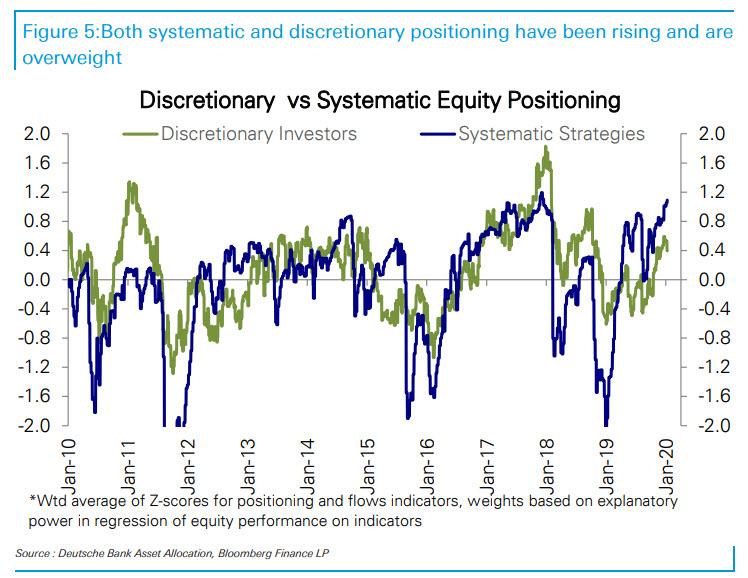
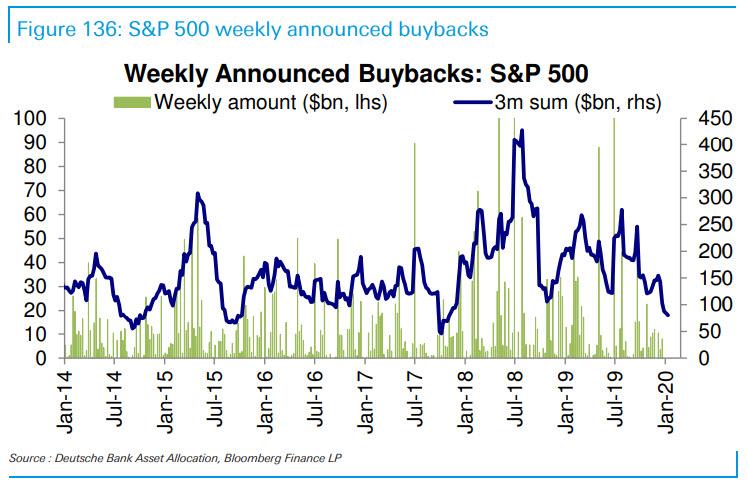
... even as retail, institutional, and systematic (CTA/risk parity/vol targeting) investors are now all in the market, just as buybacks are rapidly fading.
Sure enough, in his latest Weekly Kickstart note, Goldman's chief equity strategist, David Kostin writes that "the combination of accommodative monetary policy, low interest rates, range-bound oil prices, and continued economic expansion is constructive for US equities."
Still, with the massively overbought SPX rapidly approaching not just his (3,400) but the consensus S&P target (3,318) for the end of 2020 less than half a month into 2020, the risk of a "Feb 2018"-like swoon grows with every passing day of the the melt up euphoria, which is probably why to hedge his bets, Kostin lays out four macro risks - and associated equity strategy implications - that can derail the S&P on its path to Goldman's year-end target of 3,400 (which is less than 4% away from Friday's close of 3,265), namely
What if the US and Iran enter into a prolonged conflict and oil prices rise?
What if interest rates rise rapidly in 2020?
What if the dollar strengthens this year?
What if economic growth is weaker than we expect?
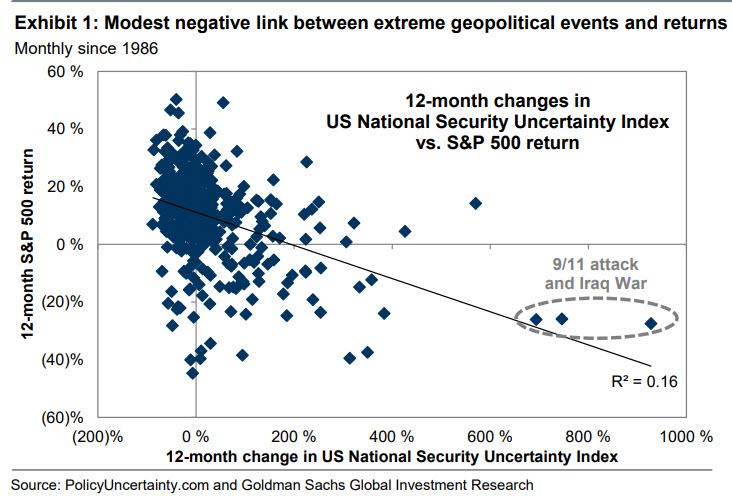
Below, we take a detailed look at each of these "biggest risks": 1. What if there is a sustained period of conflict between the US and Iran and higher oil prices? Oil prices initially rose by 4% alongside US-Iran tensions. But Goldman's commodity strategists believe the current risk premium is already elevated and they expect Brent oil prices will be roughly flat at $63/bbl during the next 12 months. According to Kostin, oil price shocks should have limited impact on S&P 500 returns, given offsetting impacts from higher Energy earnings and higher gasoline prices for consumers. Separately, in terms of geopolitical risk, the S&P 500 shrugged off the developments this week but a prolonged conflict could eventually weigh on US equities. Using the national security component of the US Policy Uncertainty Index, Goldman finds a loose negative relationship between changes in uncertainty and S&P 500 returns (Exhibit 1). However, previous notable examples of national security uncertainty also coincided with other exacerbating macro events (the first Gulf War and recession, the September 11th attacks and the Tech Bubble unwind).
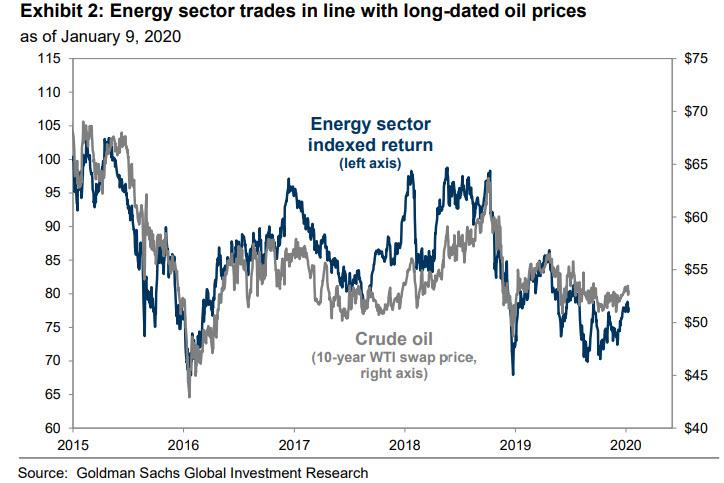
And while energy stocks have given back their gains, suggesting little investor belief in higher long-term oil prices, Defense and Cybersecurity stocks have rallied. Energy - the cornerstone of all value investing strategies - was the worst-performing sector last year, lagging the S&P 500 by 20%. Here Goldman points out that although Energy equities have diverged from spot oil prices, they trade roughly in line with 10-year oil prices (Ex. 2).
For this reason, Energy sector rallies alongside the Saudi Arabia facility bombing and the most recent US-Iran tensions, which lifted spot prices but not long-dated prices, have been short-lived. Without a sustained supply shock that impacts long-term oil prices, Goldman maintains its underweight recommendation in Energy stocks. In contrast, Aerospace & Defense and cybersecurity firms with business models more clearly linked to geopolitical conflicts have each rallied by 2% (here Goldman notes the stocks with the fastest 2020E EPS growth: FEYE, RPD, MIME, SAIL, and HII).
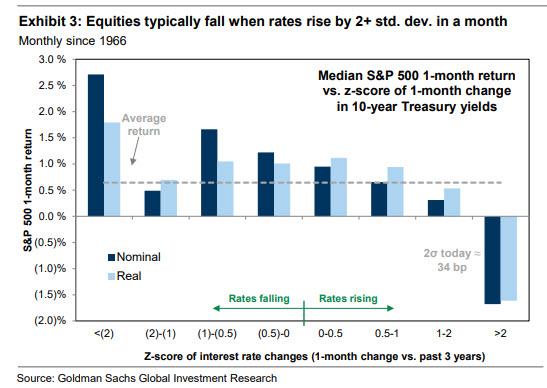
* * * 2. What if bond yields rise rapidly in 2020? Needless to say, near record low bond yields have been a boon to equity valuations, driving more than 90% of the S&P 500 return in 2019. Although valuations are elevated in absolute terms, Goldman's macro model suggests that equities trade at roughly fair value relative to the low level of bond yields (which is ironic because most "experts" claim that while bonds are in a massive bubble, equities aren't, even though you can't have one without the other). Goldman's economists expect the Fed will remain on hold in 2020 and the 10-year US Treasury yield will gradually rise to 2.25% by year-end. For equities, Goldman (and UBS) previously found that the speed of rate changes matters more than the level of rates. Historically, equities have been able to digest gradual increases in bond yields of less than 1 standard deviation in a month (16 bp in today’s terms). However, when bond yields rise by more than 2 standard deviations in a month (34 bp), S&P 500 returns have typically been negative.
Here Goldman points out that its interest rate sensitive basket has lagged since early 2019, consistent with a falling rate environment; the bank's sector-neutral basket comprises 50 S&P 500 stocks with the highest positive stock price sensitivity to changes in the 10-year US Treasury yield. The basket has continued to underperform since late November even as rates moved higher, reflecting skepticism that rates will rise substantially. However, these stocks should outperform if interest rates rise sharply (even as the broader market tumbles).
* * * 3. What if the US dollar reverses course and strengthens in 2020? The dollar fell by 2% in December as US-China trade tensions eased and global economies showed signs of improvement. And alongside virtually every other Wall Street desk, Goldman's FX strategists expect the trade-weighted dollar to fall by another 2% during the next 12 months. Why? Because a stronger dollar would pose a headwind to S&P 500 sales, particularly within industries with high non-US sales such as semiconductors. Based on Goldman's top-down earnings model, the bank estimates that every 10% change in the trade-weighted dollar equals roughly $3 (2%) of S&P 500 EPS.
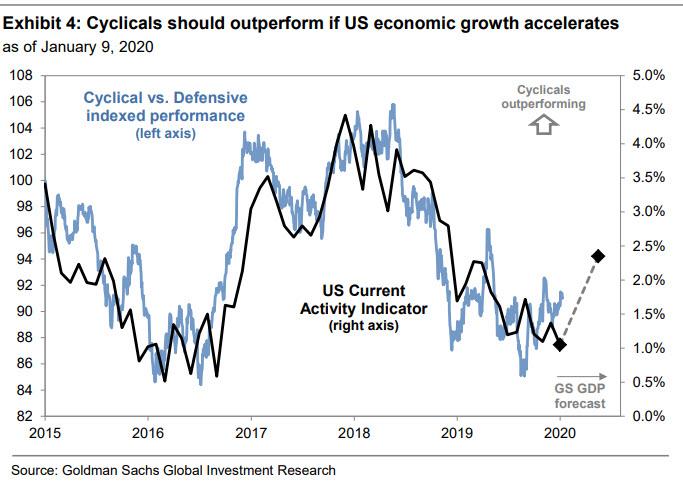
* * * 4. What if economic growth is weaker than expected? Perhaps the $64 trillion question, Goldman admits that economic data in the US have been mixed. While the ISM non- manufacturing index was above consensus, the ISM manufacturing index unexpectedly declined to the lowest level since 2009. Goldman economists expect US real GDP growth will equal 2.2% in 2020, above consensus of 1.9%, as the easing in financial conditions lifts economic activity; as a result of central bank easing in 2019, the forward P/E multiple expanded from 15x to nearly 19x. Looking forward, Kostin believes economic and earnings growth will drive stock prices higher. Every 1 pp change in US real GDP growth equals $5 (3%) in S&P 500 EPS. Ironically, the muted outperformance of cyclical equities, in particular Industrials, suggests limited growth optimism in equity markets, which in turn means that traders are betting that central banks will again push stocks to new nosebleed highs in 2020. Here Kostin notes that Goldman's Cyclical (GSSBCYCL) and Defensive (GSSBDEFS) baskets closely track changes in the GS US Current Activity Indicator (Exhibit 4).
And as we have extensively pointed out in recent weeks, the S&P 500 has surged but Cyclicals have only modestly outperformed Defensives, as "bullish" strategies actually generated a negative return in 2019. In Goldman's view, "receding trade tensions rather than overly optimistic growth expectations have driven equity returns", which is amusing because the real driver have been central banks. In any case, Goldman sees scope for upside to Cyclicals in the near term if growth reaccelerates towards its economists’ forecast, and as such the bank recommends an overweight in Industrials.
* * *
One final point: just as Deutsche Bank noted yesterday, Goldman confirms that investor positioning in US equities is close to “stretched” territory and could exacerbate equity price moves if one of these risks materializes. Goldman's Sentiment Indicator (“SI” combines six weekly and three monthly indicators of stock positioning across institutional, retail, and foreign investors. As equities rallied during the final weeks of 2019, investors added length, bringing the SI to 1.8 standard deviations above the 52-week average. This is notable because as Kostin concludes, "readings in “stretched” territory above +1.0 standard deviations have typically corresponded with below-average equity returns during the subsequent eight weeks."
combines six weekly and three monthly indicators of stock positioning across institutional, retail, and foreign investors. As equities rallied during the final weeks of 2019, investors added length, bringing the SI to 1.8 standard deviations above the 52-week average. This is notable because as Kostin concludes, "readings in “stretched” territory above +1.0 standard deviations have typically corresponded with below-average equity returns during the subsequent eight weeks."