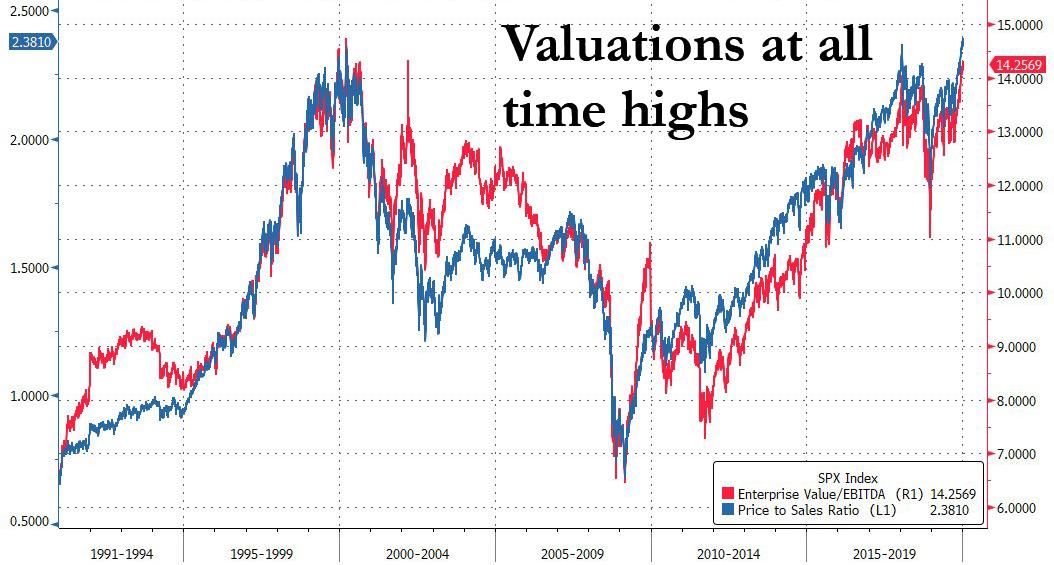
Earlier in my post, you saw this chart below- US markets at All Time High Valuations
Now look at this
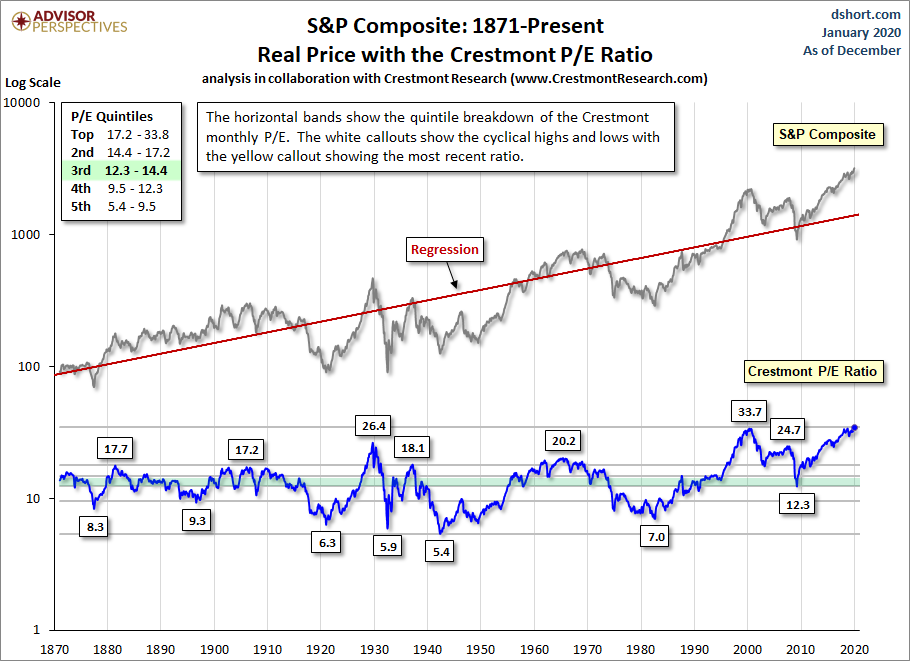
The Crestmont P/E of 34.5 is 135% above its average (arithmetic mean) and at the 100th percentile of this fourteen-plus-decade series. We've highlighted a couple more level-driven periods in this chart: the current rally, which started in early 2014, and the two months in 1929 with P/E above the 25 level. Note the current period is within the same neighborhood as both the tech bubble and the 1929 periods, all with P/E above 25 and is certainly in the zone of "irrational exuberance".
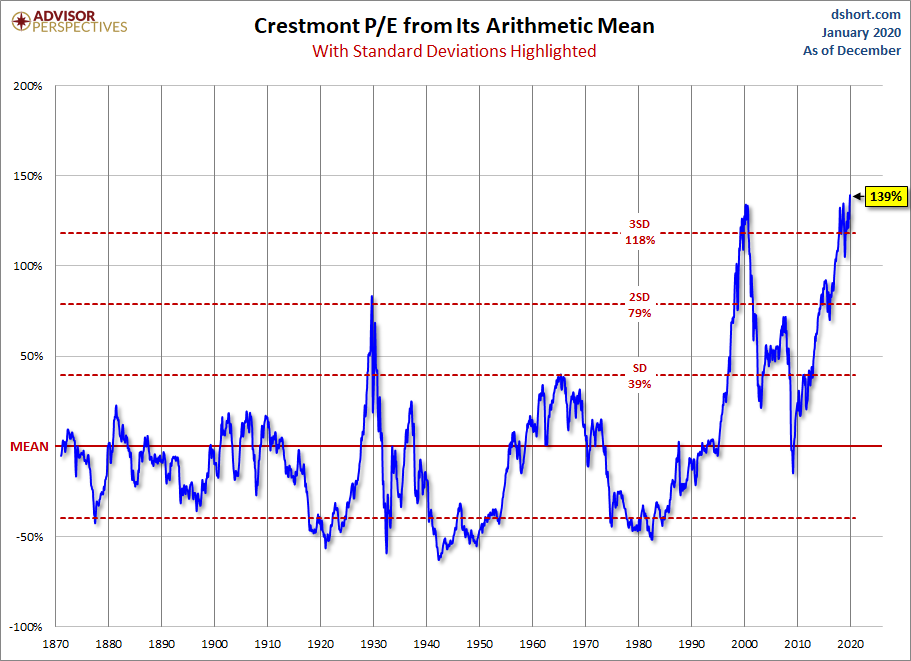
Here is the historic Crestmont P/E ratio from its mean (average) and geometric mean with callouts for peaks and troughs along with the latest values.
- And this below is the subsequent 10 year nominal total return after the bubble is bust each time

Earlier in my post, you saw this chart below- US markets at All...
-
- There are more pages in this discussion • 21,823 more messages in this thread...


You’re viewing a single post only. To view the entire thread just sign in or Join Now (FREE)