Last week, we noted that this mind-numbingly narrow channel, extremely low volatility, and high complacency remain. As we said then: “However, as is always the case, at some point, this will reverse itself. What triggers it is unknown, but a good warning sign will be a violation of the 20-DMA. As noted, we suspect such a violation will trip the algorithms into “sell” mode and increase downside price pressures. The problem for investors is that this bullish trend has already lasted much longer than expected and could continue. Therefore, we must maintain our current positioning and remain vigilant for a break of the trend channel to take more aggressive risk reduction actions.
As they say at amusement parks, ‘Make sure your seat belts are fastened securely and enjoy the ride.'”
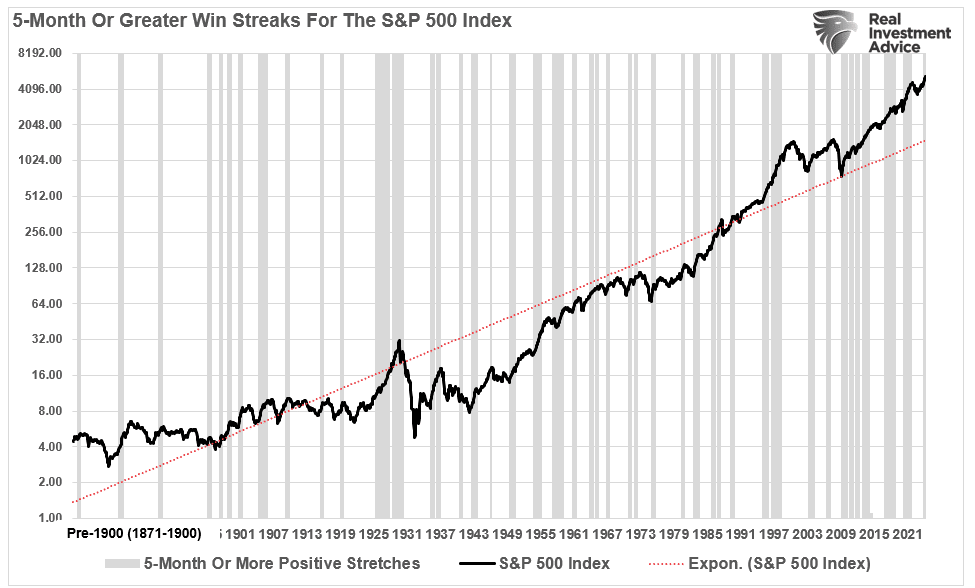
With March behind us, the market has posted 5-consecutive months of gains. While not entirely uncommon, some interesting data points surround such win streaks from the chart below.
There are several important takeaways from the chart above.
All periods of consecutive performance eventually end. (While such seems obvious, investors tend to forget during long bullish stretches.)
Performance streaks tend to cluster as price momentum and bullish psychology expand.
Given the extremely long period of market history, such long stretches of bullish performance are prevalent following declines.
Such periods of performance often, but not always, precede fairly decent market corrections or bear markets.
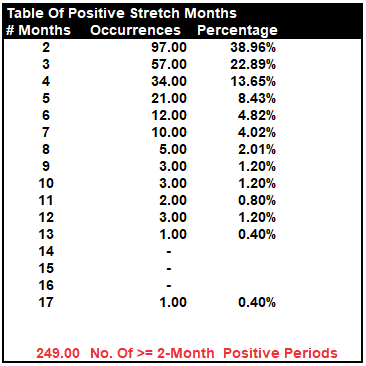
The table below shows all periods with two months or more of consecutive positive returns. The table shows that nearly 40% of the time, two months of positive performance are followed by at least one month of negative performance. Conversely, three consecutive positive months occur 23% of the time, and only 14% of occurrences stretch to 4-months. 5-month stretches have only occurred 8.5% of the time.
Since 1871, there have only been 21 occurrences of 5-month stretches of positive returns before a negative month appeared. In total, there are just 61 occurrences, or 25%, out of 249 periods where the market ran five months or longer without a correction.
What is essential to take away from the data is that every period of consecutive positive monthly returns eventually ends. Yes, sometimes those endings are very mild. However, sometimes they were not.
In the current bull market, few people are willing to sell, so buyers must keep bidding up prices to attract a seller to make a transaction. As long as this remains the case and exuberance exceeds logic, buyers will continue to pay higher prices to get into the positions they want to own.
Such is the very definition of the “greater fool” theory.
However, the bulls remain in charge as Q1 earnings season approaches.