Source: www.stockcharts.com
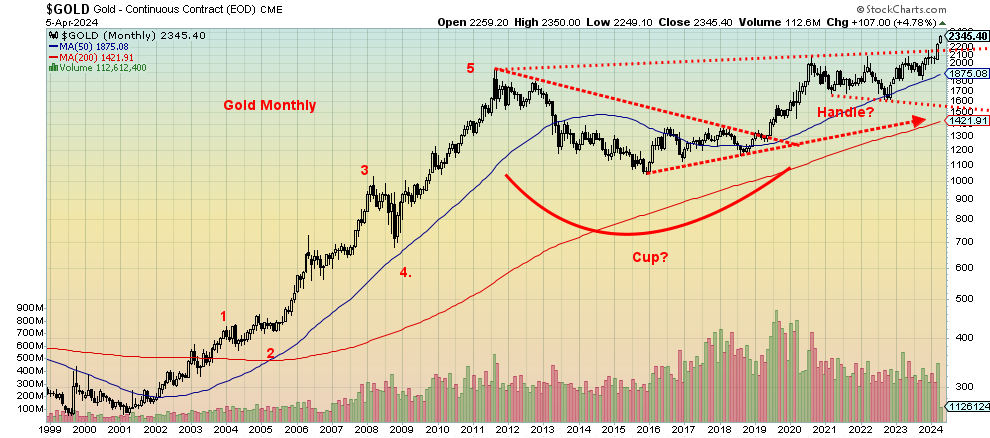
Our long-term chart of gold suggests it is making a major breakout from what appears as a cup and handle pattern. The cup was formed during the long period from 2011 to 2020. Gold rose sharply out of the pandemic low in March 2020. However, since then it has been in a downward/sideways pattern, forming what we believe is the handle of the pattern. With its breakout above $2,200 it appears to be busting above the handle. If that is correct, the pattern suggests that gold could have targets up to $3,050 zone with potential minimum objectives to $2,375/$2,385. Gold is now crossing over $2,300 (June futures front month).
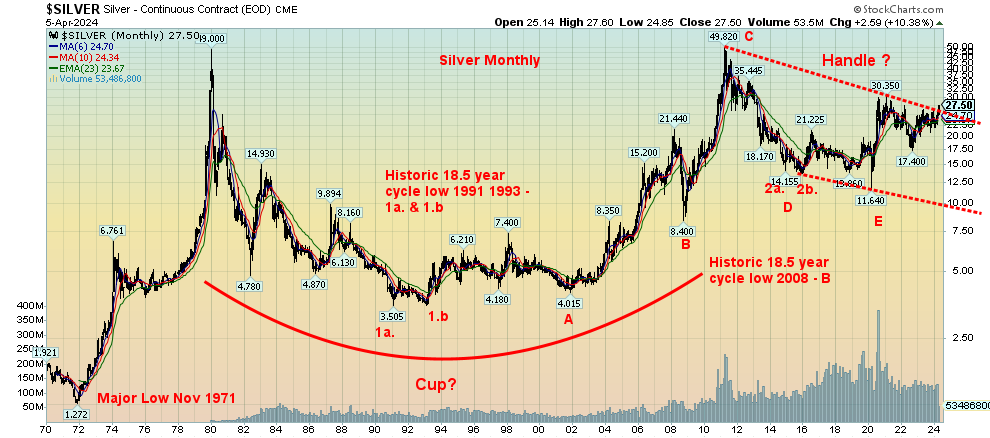
We have a similar pattern on silver, only the pattern is more massive and dates from the highs of 1980. The cup was the long period between 1980 and roughly 2006 when silver broke above earlier highs. The second peak in 2011 at roughly the same level as 1980 started the formation on what appears as the handle and projects silver to potentially rise to about $75 once we clear above $27.50. Minimum potential targets appear to be $38/$40. Could it all be a false breakout? Possibly but the fundamentals behind it are strong so a false breakout is unlikely.
These are significant breakouts and they do come after what we believe were important cycle lows for both gold and silver. Gold made its 7.8-year cycle low and possibly the 23.5-year cycle low in November 2016. Silver made what may be an important half-cycle low to the 18.5-year cycle in March 2020. We are now going into the second half of that cycle and it is potentially the most explosive.