US Chicago PMI (Business Barometer) 35.4
!
https://x.com/joosteninvestor/status/1804519828322975857
US bankruptcies are rising rapidly:
275 large companies have declared bankruptcy through May of this year, the 2nd highest since 2010.
Over the last 14 years, only 2023 saw a higher count of bankruptcy registrations, at 277. In May 2024 alone, 62 firms have gone bankrupt, the 3rd largest monthly number since 2020.
Most bankruptcies have been seen in consumer discretionary companies as Americans continue scaling back their spending.
Red Lobster is one of the notable examples which just filed bankruptcy. More signs of economic weakness are emerging.
https://x.com/KobeissiLetter/status/1804574607401210118
..this below may be 6 months old but I believe still relevant given recent US data.
Is the US economy heading for a soft landing? Part 1/2
Arguments for and against the possibility that the US economy will avoid a recession during this business cycle
GLOBAL MARKETS INVESTOR
DEC 17, 2023
INTRODUCTION
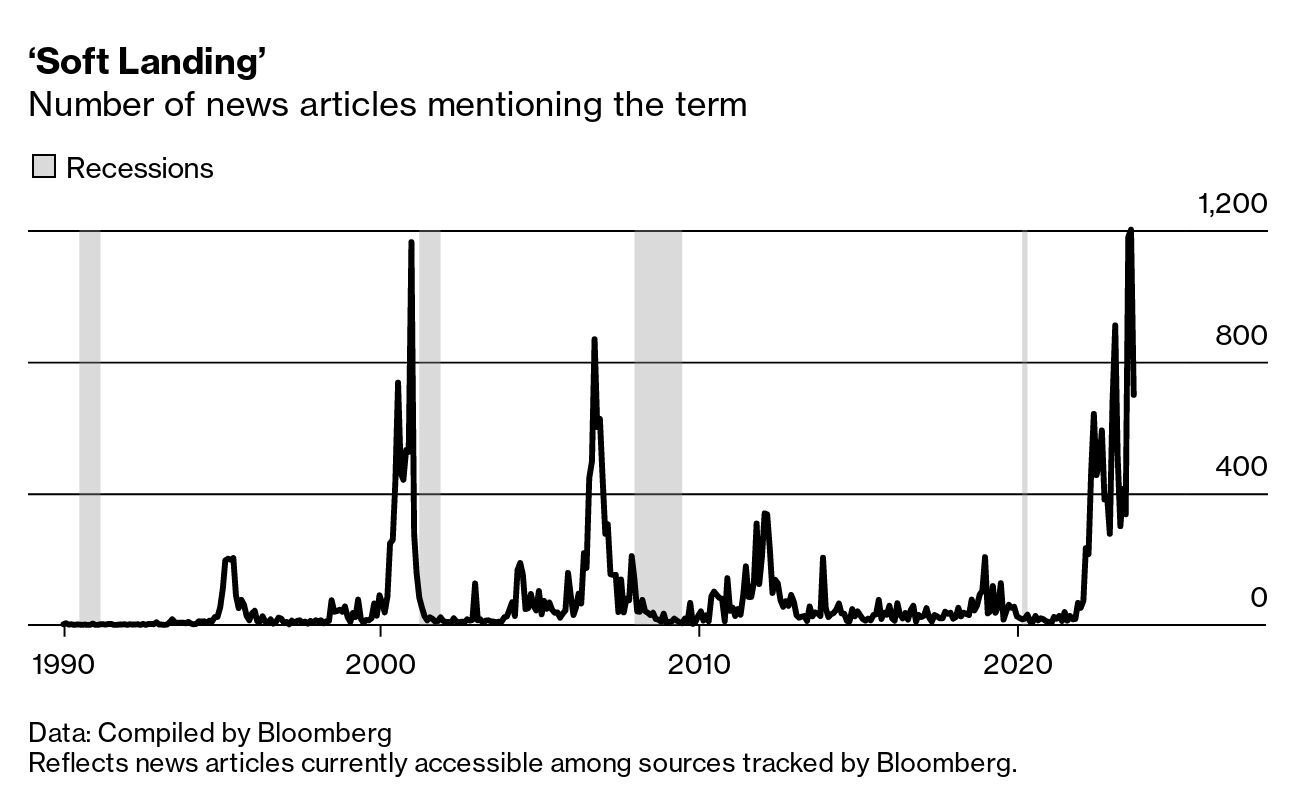
Over the last several months there has been an ongoing debate about the possibility of a soft landing in the largest economy in the world, the United States. The graphic below shows that in the third quarter of 2023, the number of news articles mentioning the term has reached a record of more than 1,200 stories.
“Soft landing” is a term widely used in financial markets and economics meaning a period of rising interest rates and tightening financial conditions that does not end up with even a quarter of negative economic growth. In other words, an interest rates hiking cycle conducted by a central bank without causing a recession. Soft landing is an implicit goal of every central bank during each economic cycle. In the past, however, in the US, the Fed has not been successful in reaching such a goal. The chart below presents more than 40 years of quarterly GDP growth and the interest rate level in the country.
As you can see, over the last 43 years there was only one occurrence of the so-called soft landing highlighted using a red color. We can also describe this chart in a slightly different way. Namely, every time these small blue-gray bars fell below 0% (right axis) the business cycle ended in the US with a hard landing (two consecutive negative bars mean a recession).
Therefore, why is it so difficult to achieve a soft landing? This is because when the central bank fights elevated inflation the effect of rising rates comes with a lag of 8 to 18 months. Additionally, in the modern era, a central bank shrinks its balance sheet by getting rid of government bonds and other securities, withdrawing liquidity from the financial system, and tightening financial conditions even further while the exact impact of these measures is also uncertain. In consequence, central banks typically increase rates too high as it is impossible to estimate, how high interest rates and the size of the balance sheet and at what time are needed to cool inflation without causing a recession and substantially disrupting the financial system.
THE END OF THE CYCLE
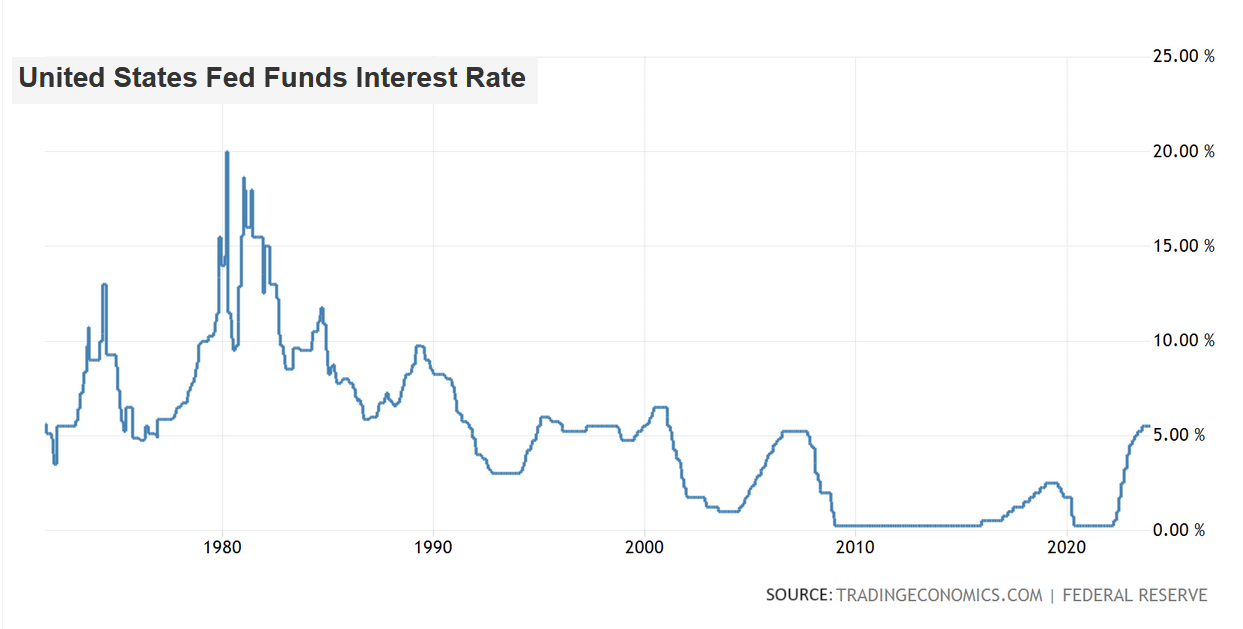
During the latest Federal Reserve meeting on December 13, the central bank hinted pretty clearly that it might be the end of the current interest rates hiking cycle as the US economy growth has been slowing in many sectors and inflation has been steadily falling. Therefore, it is likely that the current 5.50% level of interest rates is the cycle peak as presented in this figure:
For investors, however, the more important is whether the economy will be able to avoid a recession as this outcome will have a huge impact on the companies’ ability to generate revenues, maintain margins, and in effect grow their earnings which should translate to a higher share prices. The following chart perfectly presents two outcomes of this dilemma:
The white line shows that if there was no recession after the end of the regular Fed hiking cycle since 1971 then the S&P 500 rose more than 10% on average in 6 months. On the other hand, if a recession occurred, the index fell more than 10% on average as the blue line explains. As we can see, the game is worth the candle. Thus, let’s dig deeper into economic data to see what awaits the world's largest economy.
ARGUMENTS FOR HARD LANDING OR A RECESSION
Almost every investor, analyst, economist, or market watcher usually tends to follow his favorite indicators which they believe are the most useful. As we know, the economy is an extremely large organism and consists of thousands of different gauges and measures, and it is impossible to follow them all. Moreover, probably every time in each business cycle other data is relevant. In my view, this time it would be worth looking at some leading indicators and those related to the banking sector as well as consumers. Leading indicators try to provide information about what’s coming ahead instead of what has already happened which for example unemployment data shows. The banking sector is usually one of the most vulnerable during the interest rate hiking cycle while consumers are the main fuel of the US economy in almost every business cycle which is why I have chosen all of them.
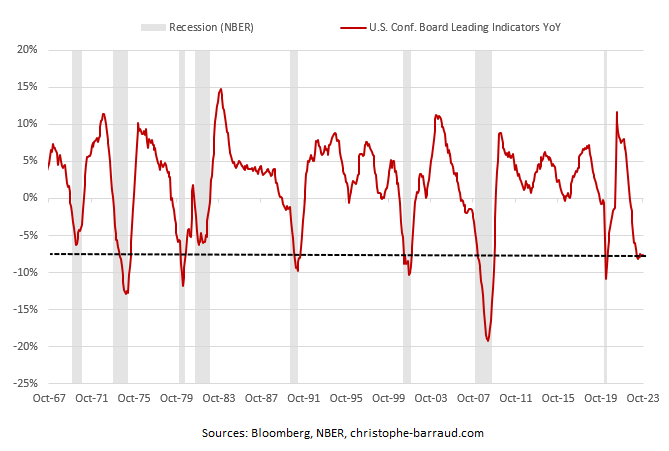
The first gauge is the Conference Board Leading Economic Index (LEI), a forward-looking economic indicator calculated using 10 different measures such as consumer expectations, housing data, manufacturing and services orders, working hours, jobless claims, consumer credit data, US bond yields, and US stock prices. This index provides an early indication of significant turning points in the business cycle. In other words, it can predict when the economy starts to recover or heads into a recession.
In October, the index fell by 0.7% versus September, experiencing 19th month of consecutive decline while year over year declined by 7.6%. When you look at the the red line on the chart, in the past such a drop in the index always coincided with a recession in the United States.
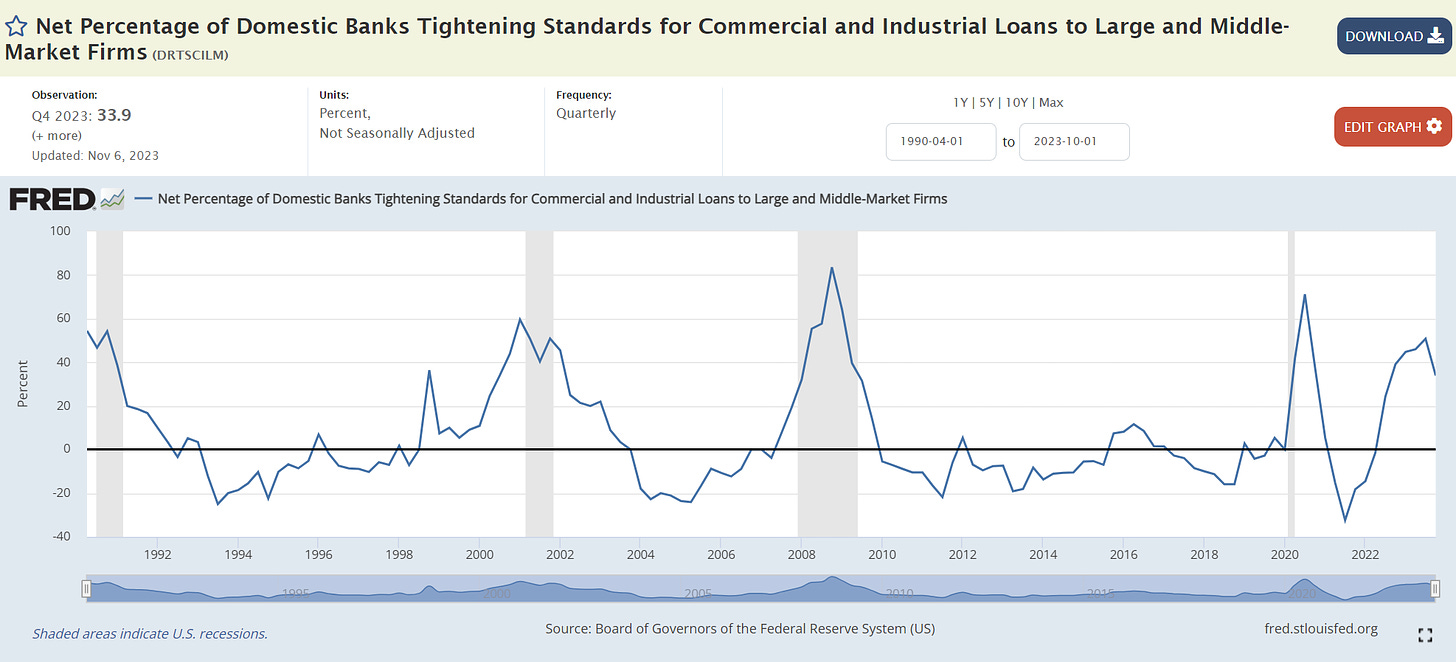
The next measure is the net share of US banks saying that they are tightening lending standards for commercial and industrial loans to large and middle firms. I did not add small firms here as they show the same outcome.
In the third quarter of this year, more than 50% of banks were saying that they are putting tougher criteria for commercial and industrial loans. This is the level that in the past was associated with a recession, though it has fallen to 34% in the fourth quarter (still elevated).
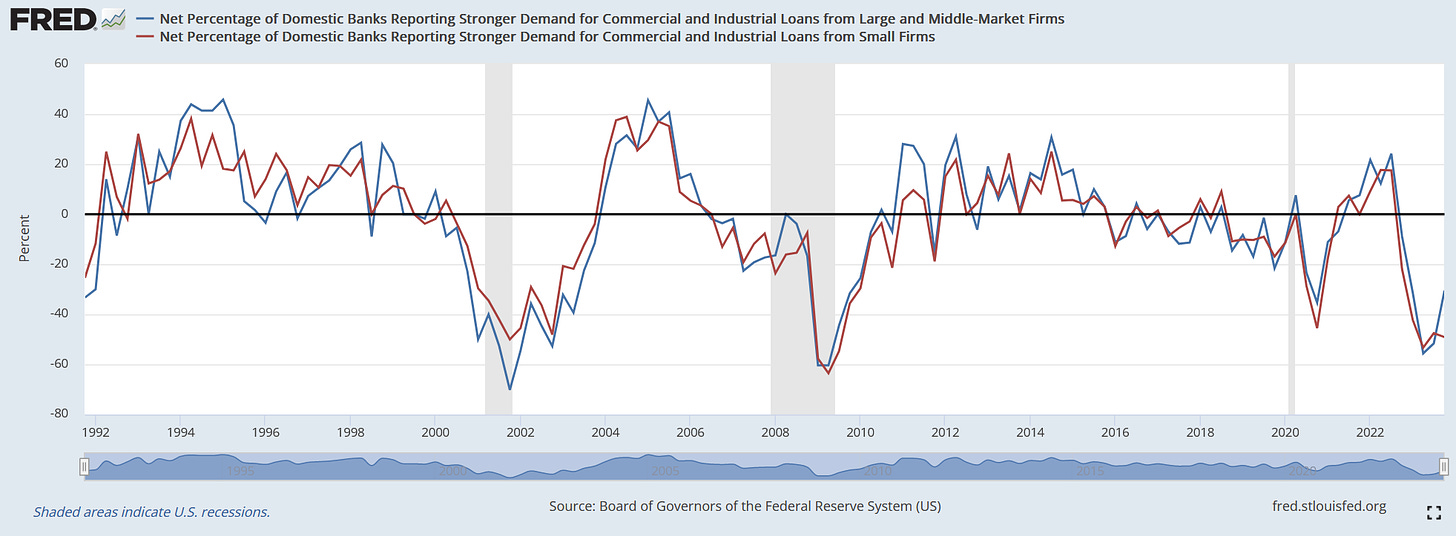
Staying with lending, the next data point shows a share of US banks reporting stronger demand (weaker demand if negative) for commercial and industrial loans from large and middle-sized firms (blue line) as well as small firms (red line).
As you can see, the demand for loans in the third quarter for both sizes was at the lowest level since the Great Financial Crisis. In the fourth quarter, it has picked up somewhat for large and middle-sized firms but has decreased for small firms. It is worth noting that the two above data points are related as tightening lending standards should negatively impact the demand for loans.
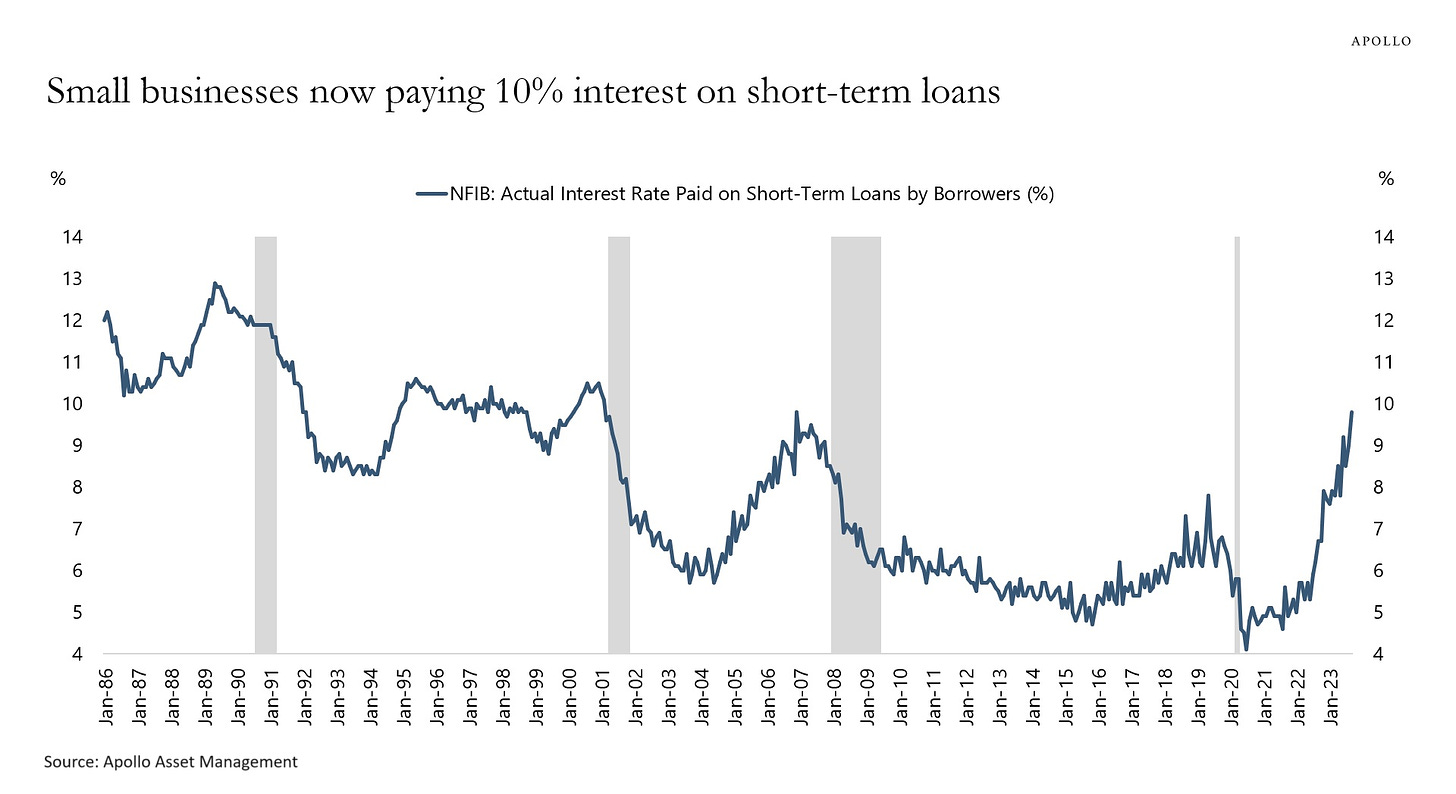
The below graphic might be an explanation as to why loan demand for small businesses has been falling. It is even more important because they are the major fuel of the US economy apart from the consumers. Notably, there are 33 million small businesses in the country accounting for a 44% share of the GDP (Gross Domestic Product).
From the chart, we can see that small businesses are now paying roughly 10% interest on short-term loans, according to the monthly survey from the NFIB (National Federation of Independent Business), This is the highest rate since 2006. It is a significant obstacle for small firms as the higher cost of obtaining capital might translate to cost-cutting in the form of lay-offs and limited investment spending which in effect may substantially limit economic growth.
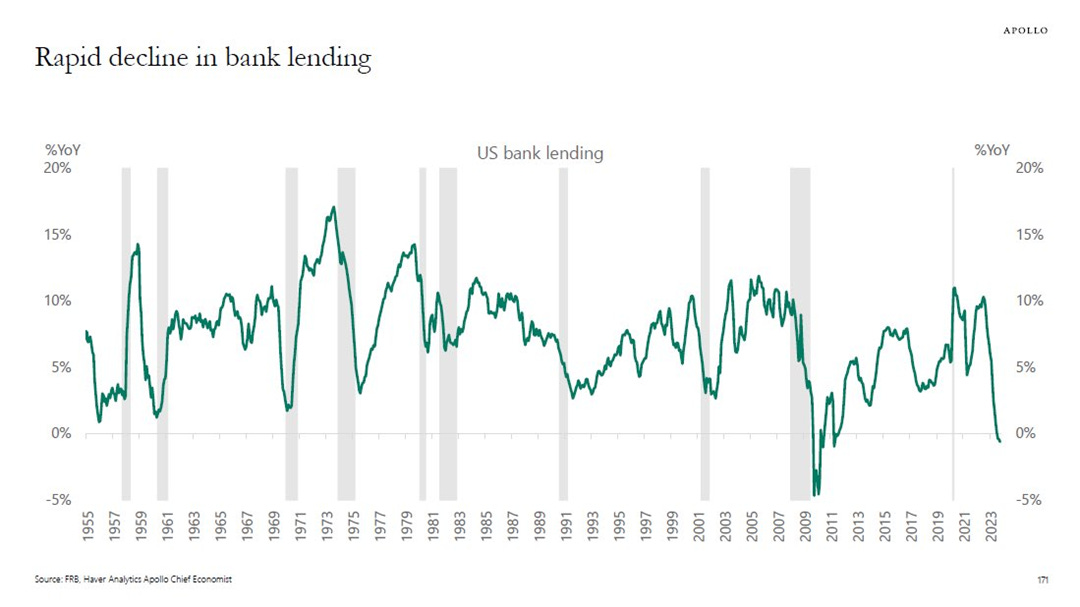
In any case, as a result of all the loan data provided above we may analyze a total US bank lending growth. As you can see, it has been rapidly declining over the last several months. Moreover, lending growth has turned negative on a year-over-year basis for the first time since 2011.
It means that companies in the world’s largest economy have pressed the brake pedal on capital spending. Less spending = less development = less economic growth.
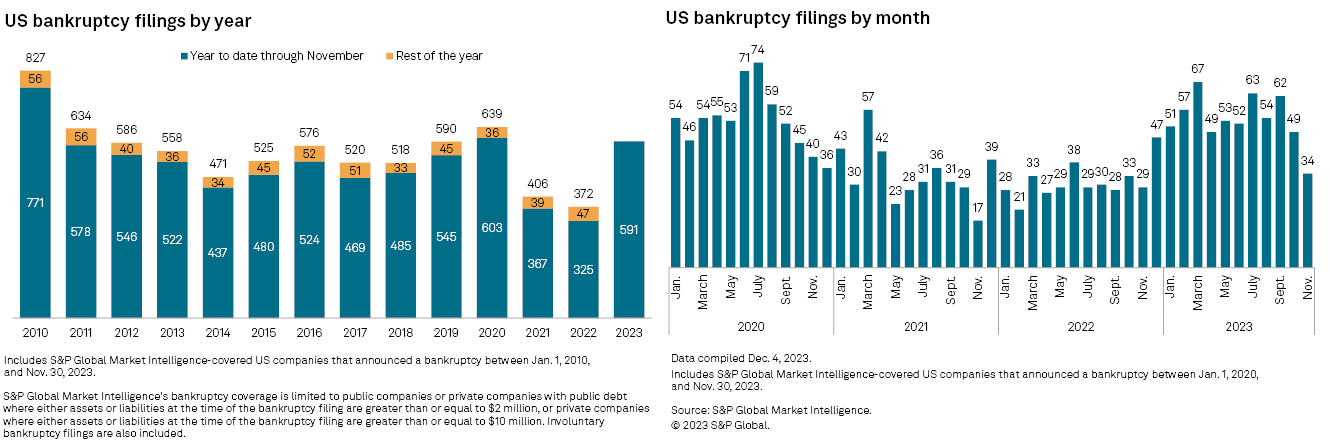
Before moving to consumers, we shall see the last data point against a soft landing related to corporations, the bankruptcy filings.
As of November 30th, there have been 591 bankruptcies in the United States year to date, the most since 2010 excluding the 2020 pandemic year. Though, in November alone there were only 34 bankruptcy fillings, the lowest monthly number this year but in the past November has usually had one of the lowest counts. This elevated number is likely the effect of higher interest rates weighing on poorly managed companies or those who have believed the Federal Reserve two years ago that inflation is transitory and they will not gonna raise interest by much. The reality is that the economy has seen the most rapid hiking cycle since the 1970s’.
In the last part of this section, it is time to move to the US consumers which by many have been seen as resilient and one of the last strengths of the economy. This argument, however, will be elaborated in the second part of this analysis. At the moment, let’s see how their ability to spend shapes.
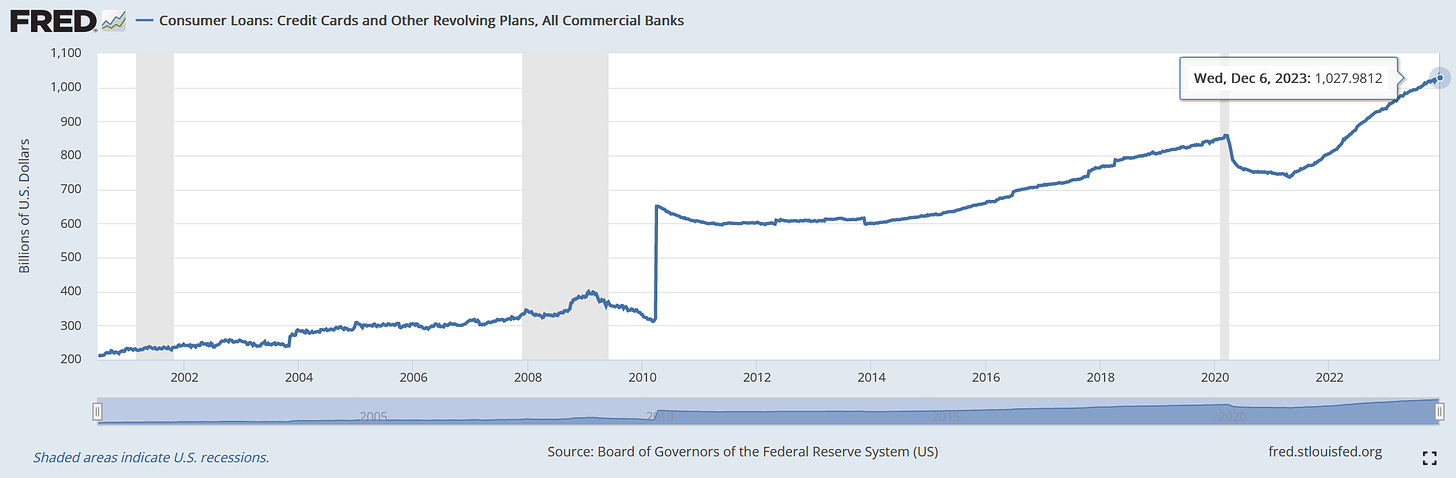
US credit card debt has breached $1 trillion for the first time in the history of the country. As billionaire Stanley Druckenmiller or JP Morgan CEO Jamie Dimon said the US consumers are 'spending like drunken sailors’ and this is a big risk for the economy.
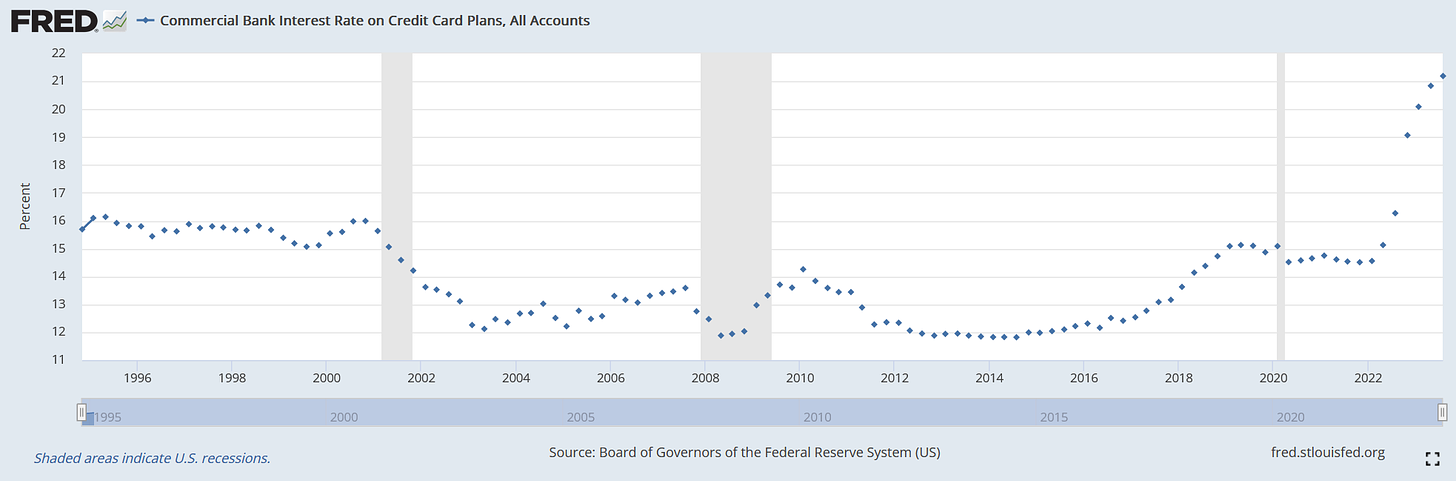
Perhaps, that would not be a problem as US citizens have been becoming wealthier over the last years. However, the debt credit card interest rates have also spiked.
Currently, the average annualized interest rate on credit cards has reached more than 21%, the most since at least the 1990s’. As it was not enough, serious delinquencies have been rising over the past two years. As a reminder, a loan becomes delinquent when a person does not make a payment by the specified due date. Serious delinquency occurs when a payment does not go through for more than 90 days. As you can see in the graphs below people aged between 40 to 70+ have been relatively fine. However, those aged between 18 and 39 who are shown using red and gray lines have been getting into some trouble with serious delinquency percentage of balances achieving levels as high as in 2009 and 2010.
The overall conclusion that comes to mind while looking at these pieces of data is that further consumer spending might be highly limited unless the Federal Reserve cuts interest rates in a couple of months.
Summing up the part elaborating the arguments for a recession or the so-called hard landing, there are many ongoing issues within the US economy pointing to a significant slowdown. If those will be extended it may cause serious economic problems for ordinary people, corporations, and policymakers. Do we know with certainty if a recession occurs? Of course, not. Last year, many economists and analysts were pointing to more than 80% and 90% probabilities of a recession in 2023 and it did not happen. Now they turned bullish and expect a soft landing. However, the longer the Fed keeps rates elevated and continues shrinking its balance sheet, the higher the probability that something eventually breaks. Unless the US government again tries to prevent the slowdown and floods the economy with money.
US Chicago PMI (Business Barometer) 35.4 !...


Featured News
Featured News
The Watchlist
NUZ
NEURIZON THERAPEUTICS LIMITED
Dr Michael Thurn, CEO & MD
Dr Michael Thurn
CEO & MD
Previous Video
Next Video
SPONSORED BY The Market Online