The Ivory Hill RiskSIGNAL™ has remained green since December 5th. Our short-term indicator is red, while our intermediate-term volatility signal is green.
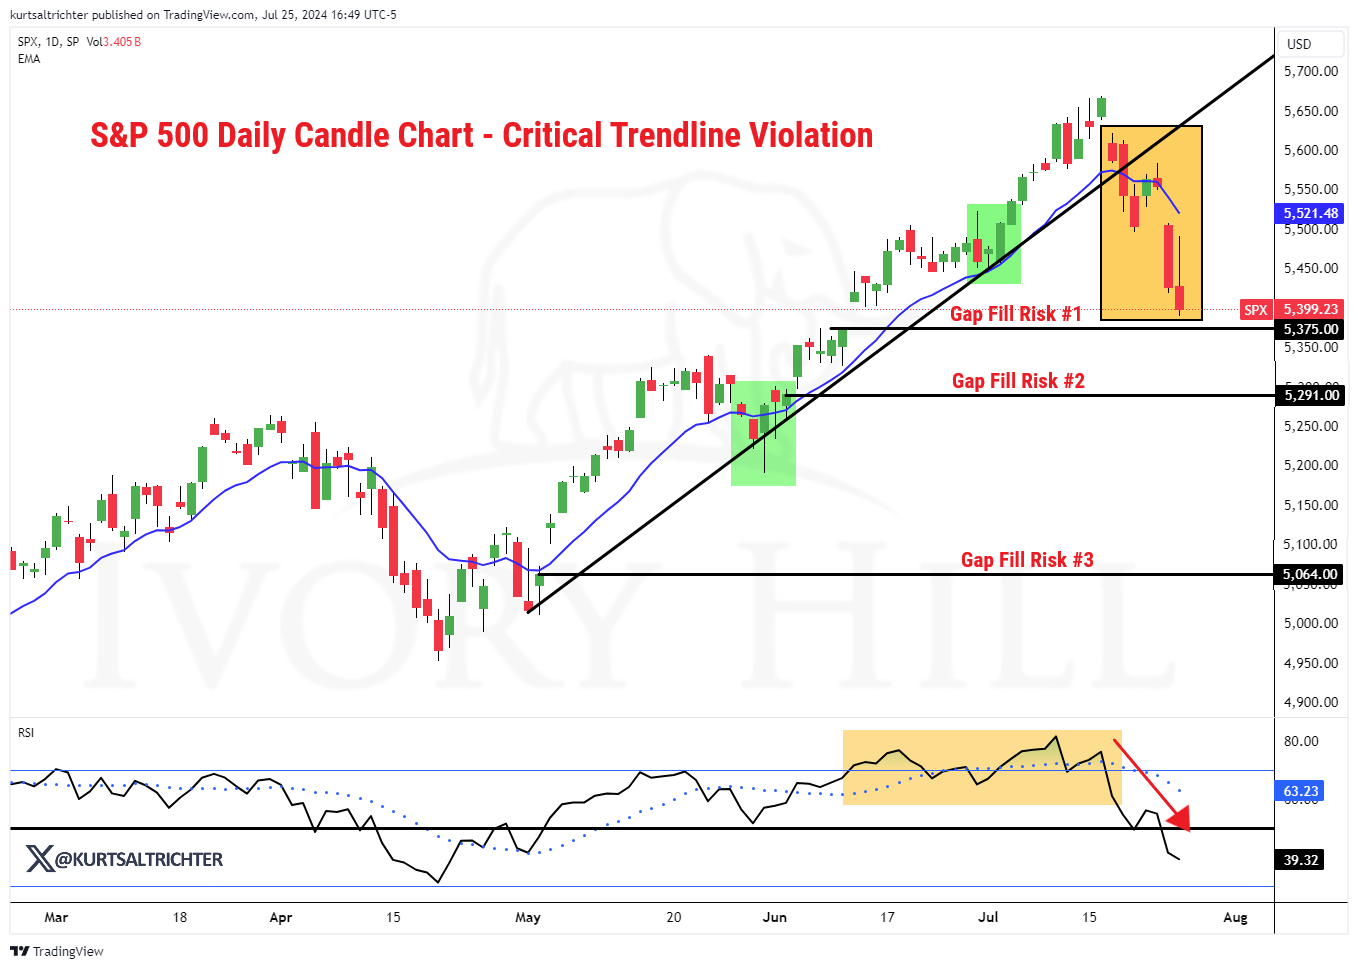
The blue uptrend line on the S&P 500 chart below has been a crucial support level since the April pullback. However, its breach last week signifies a loss of bullish momentum and a shift in the short-term market trend from upward to sideways, with an increased risk of downside gaps to 5,375, 5,291, and 5,064. Additionally, the index has now fallen to within 100 points of its 50-day moving average (MA) for the first time in several months.
Positioning update:
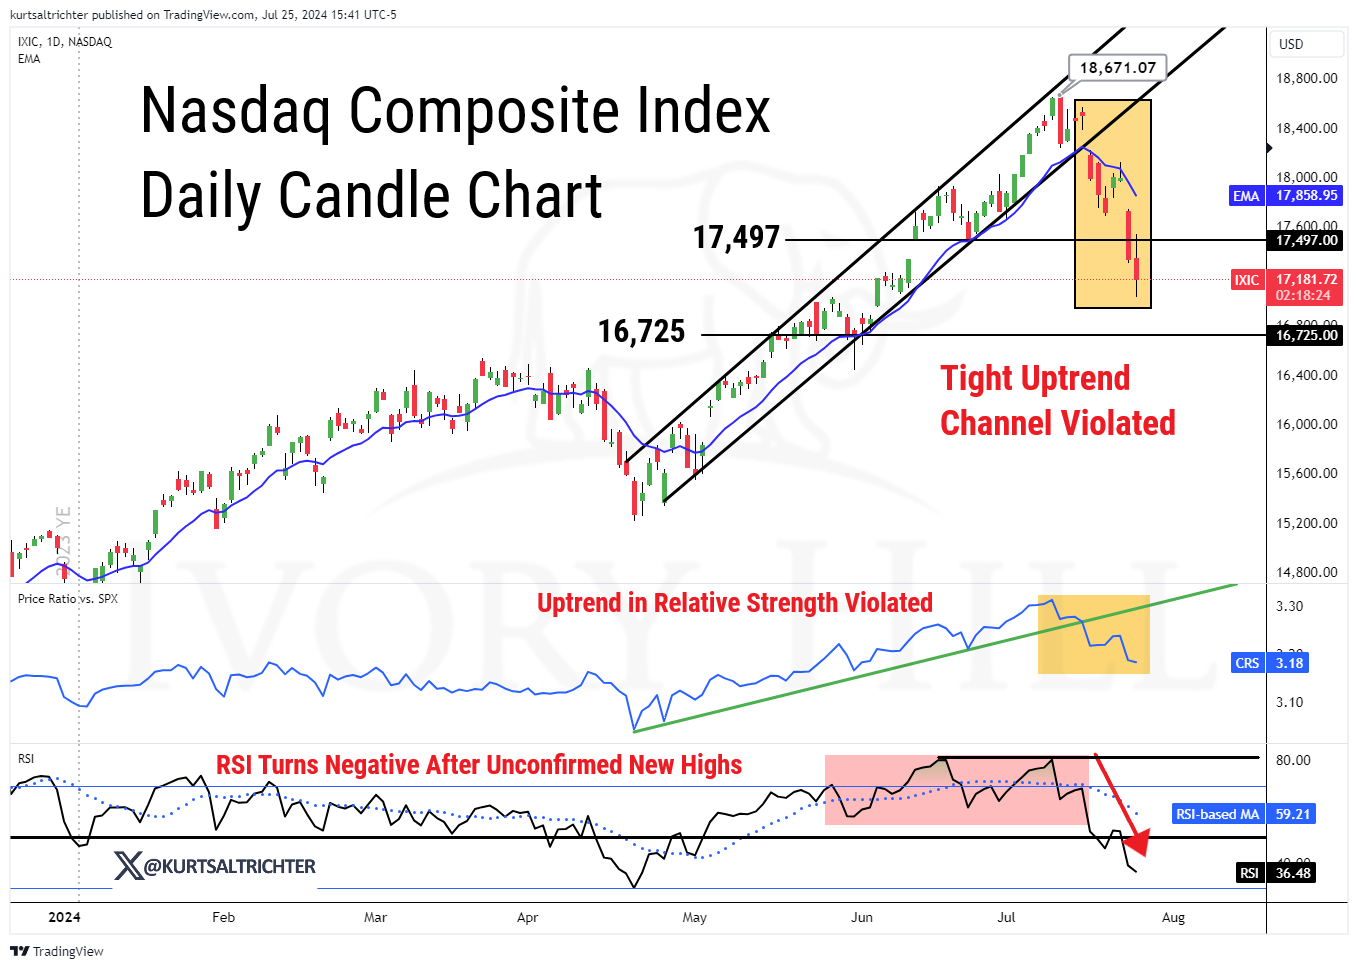
This week, we cut some of our higher beta positions in the Nasdaq, locking in some nice gains. This move was prompted by a spike in the Nasdaq volatility index (VXN), which held above 20, making higher beta positions less attractive during a higher volatility. We continue to hold our core QQQ position and will maintain it unless our long-term signal turns negative. As you can see, the Nasdaq fell through key support at 17,497, and we hope that the support does not become resistance, but it may take a few weeks to regain ground. I plan on cutting our high-beta S&P 500 holdings as well if the VIX starts trending above 20 or our long-term signal flips red. As I write this, the VIX is sitting at 16.
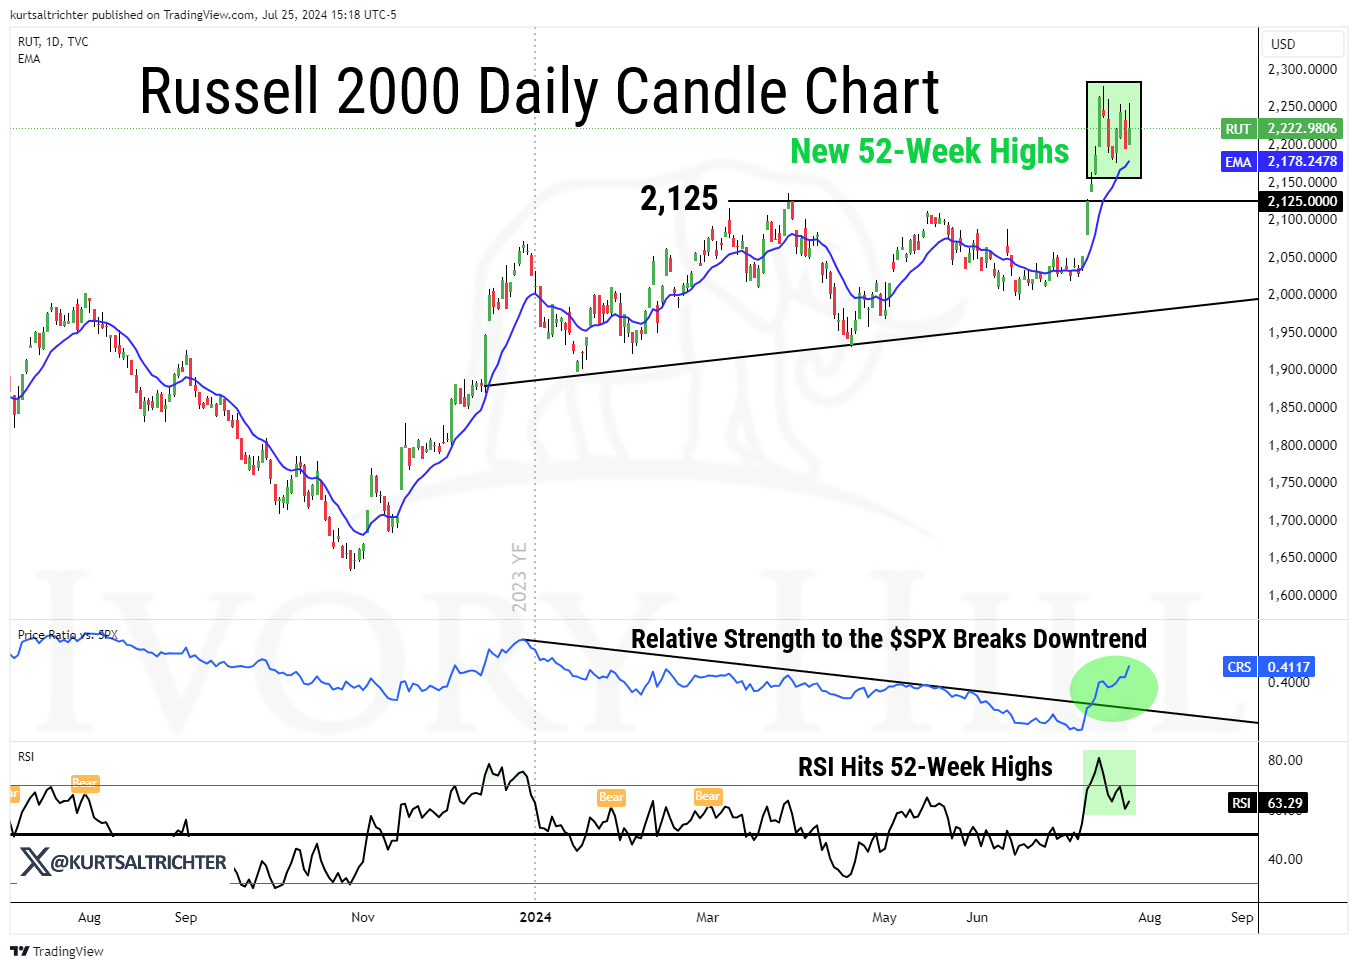
Last week, we added small caps following the breakout. Despite the impressive rally in small caps, I remain cautious about its sustainability. My view is that this might be an oversold rally rather than a genuine rotation into small caps. If we observe continued strength in small caps, we will consider increasing our position size.
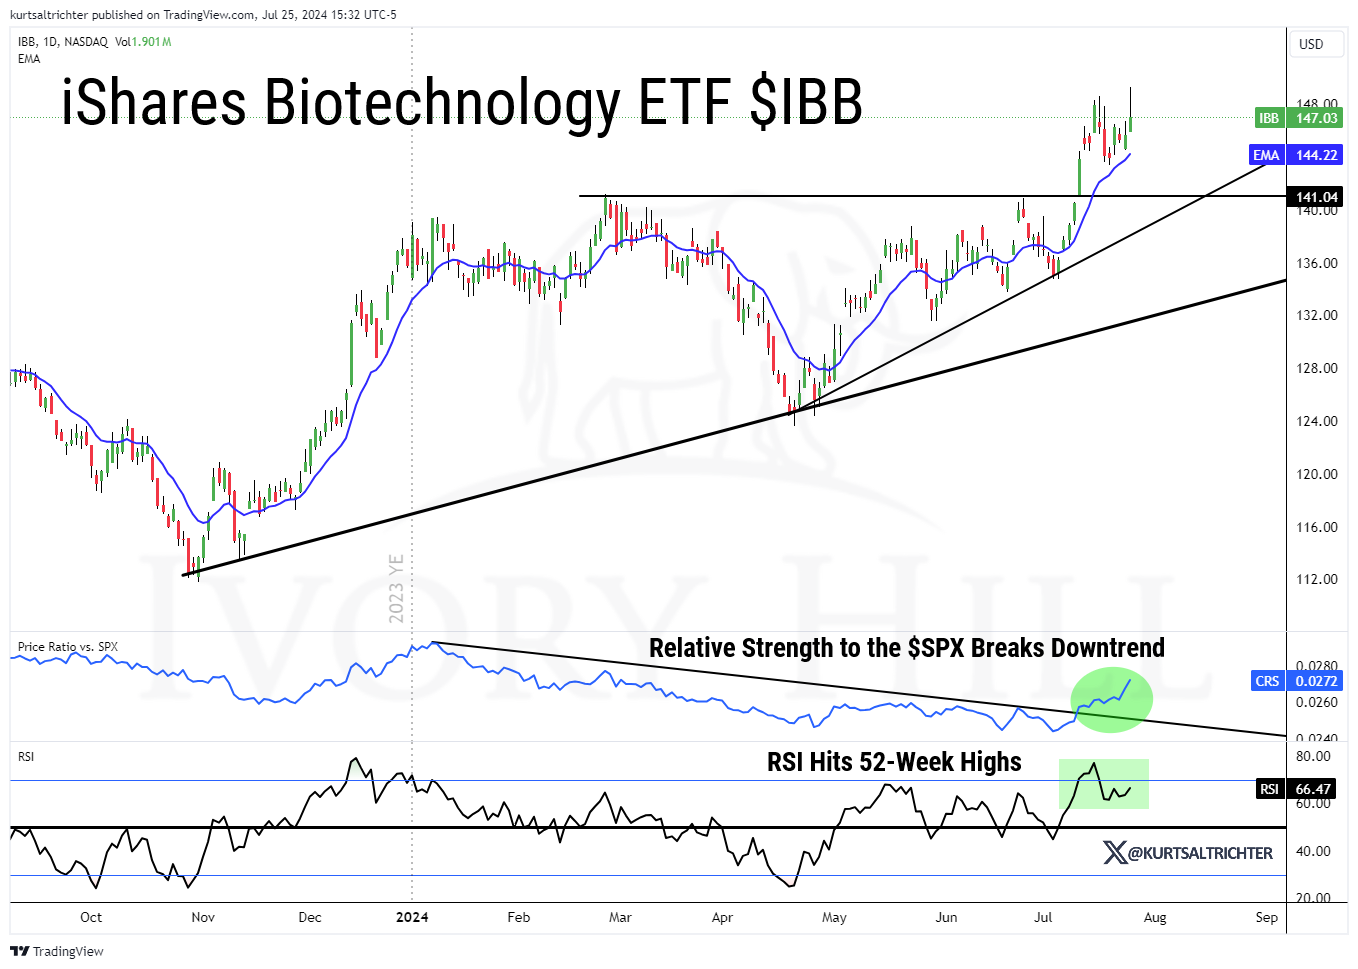
We also increased our allocation to biotech stocks last week and this week. If small caps maintain their strength, having exposure to biotech stocks is where we will see the most growth.
What is Causing This Pullback?
The decline in stocks broadened and intensified this week, with the S&P 500 now down 3.71% from its record high last Tuesday. While some analysts are interpreting this as a sign of future economic slowdown or political market reactions, the true cause is less dramatic but still important: positioning and earnings.
Two weeks ago, a favorable Consumer Price Index (CPI) report led investors to believe that a September rate cut was a certainty. This optimism caused yields to fall and prompted investors to shift their focus from mega-cap tech stocks to more cyclically-oriented sectors that had been underperforming, such as small caps, industrials, financials, and value stocks (RSP) over the broader S&P 500 (SPY).
This rotation, although detrimental to the tech-heavy S&P 500, was neutral to positive for the rest of the market. Underperforming sectors began to catch up, illustrated by the 11% surge in the Russell 2000 over five trading days.
However, after six days of intense rotation, the market attempted to stabilize on Monday but was disrupted by earnings reports, particularly from tech companies. ASML missed its estimates, followed by disappointing results from GOOGL and TSLA, increasing the selling pressure on an already stressed tech sector. With tech stocks declining and earnings from other sectors remaining neutral at best, the market experienced significant declines yesterday.
This current pullback isn't driven by major macroeconomic concerns but by an overextended tech sector and disappointing earnings. Although this situation is challenging for portfolios, it's different from a larger, more negative macro shift such as slowing growth, no Fed rate cuts, or rising inflation.
There are two key takeaways:
In the short term, strong earnings could halt this pullback and keep it manageable. The key index to watch is SOXX, which needs to stabilize for the rest of the market to follow.
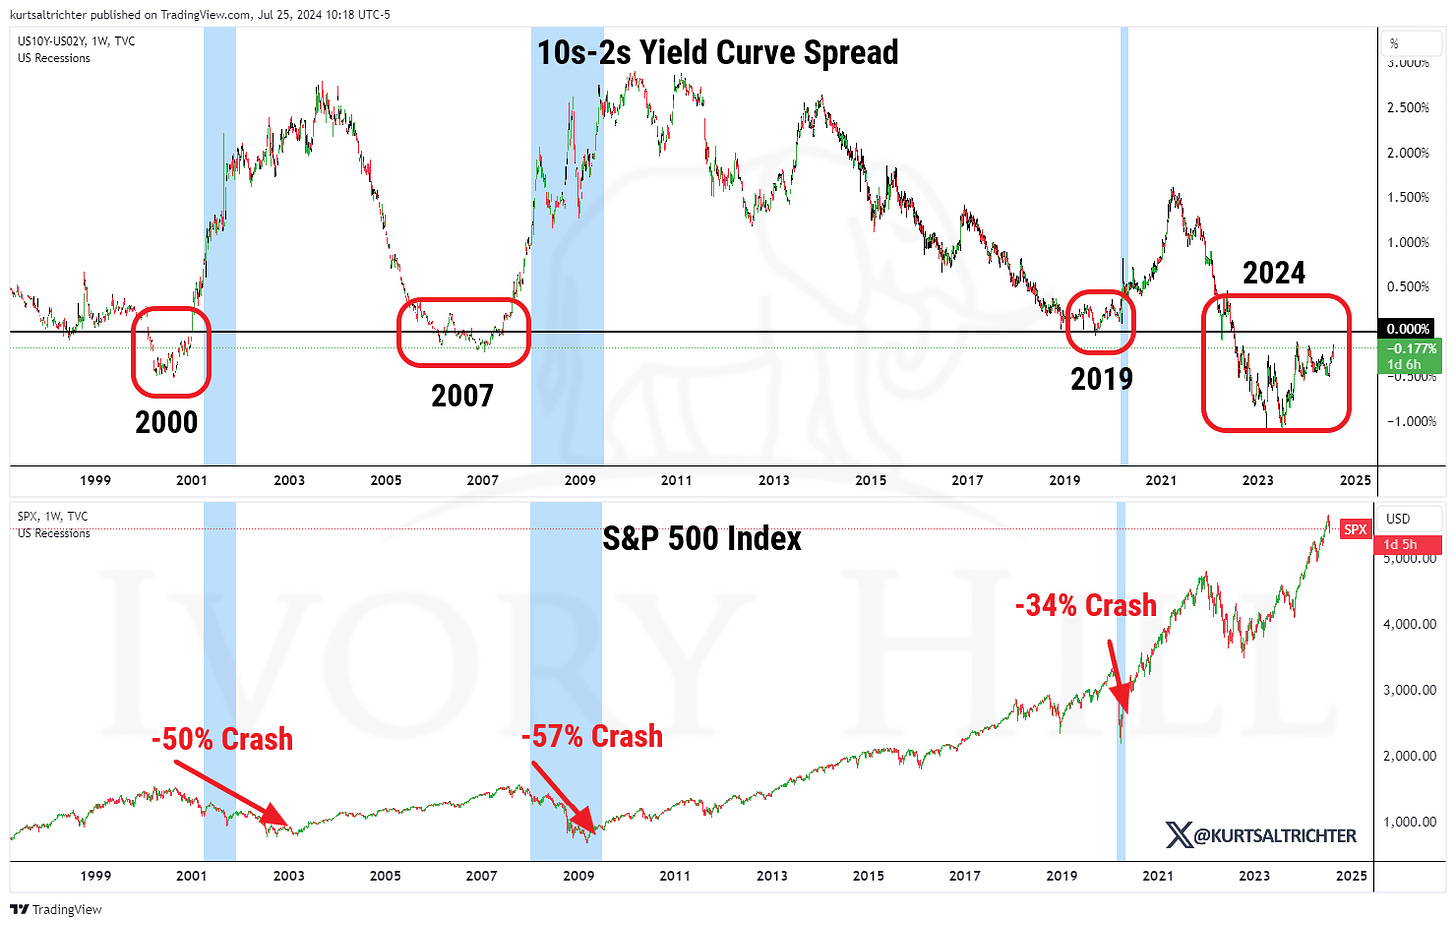
This pullback does not currently include growth worries, but we must monitor this closely. If growth concerns arise, the situation could worsen. Although recent data has been "ok," the rising 10s-2s yield spread, now at its highest level since July 2022, indicates potential risk.
The 10s-2s spread, now at -15 basis points, is nearing positive territory. Historically, when the yield curve inverted for an extended period and then turned positive, the S&P 500 fell significantly.
While this spread alone isn’t a reason to sell stocks, it warrants increased vigilance and portfolio volatility audits.
In this environment, defensive sectors, minimum volatility ETFs, and hedged equity ETFs remain viable options, as they provide long exposure while potentially outperforming if growth worries intensify or earnings disappoint further.
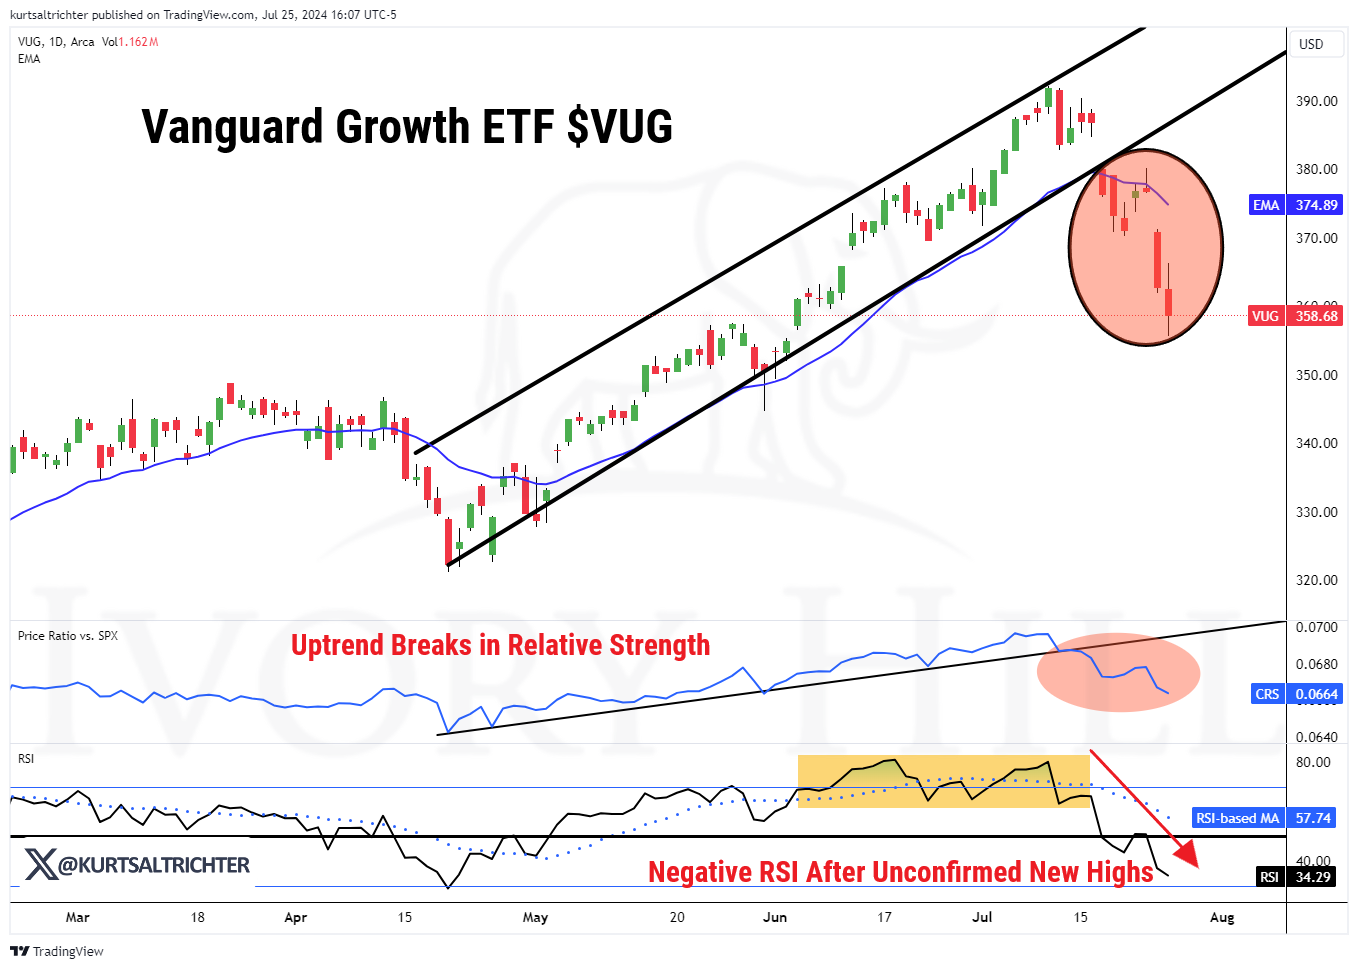
Growth stocks are out.
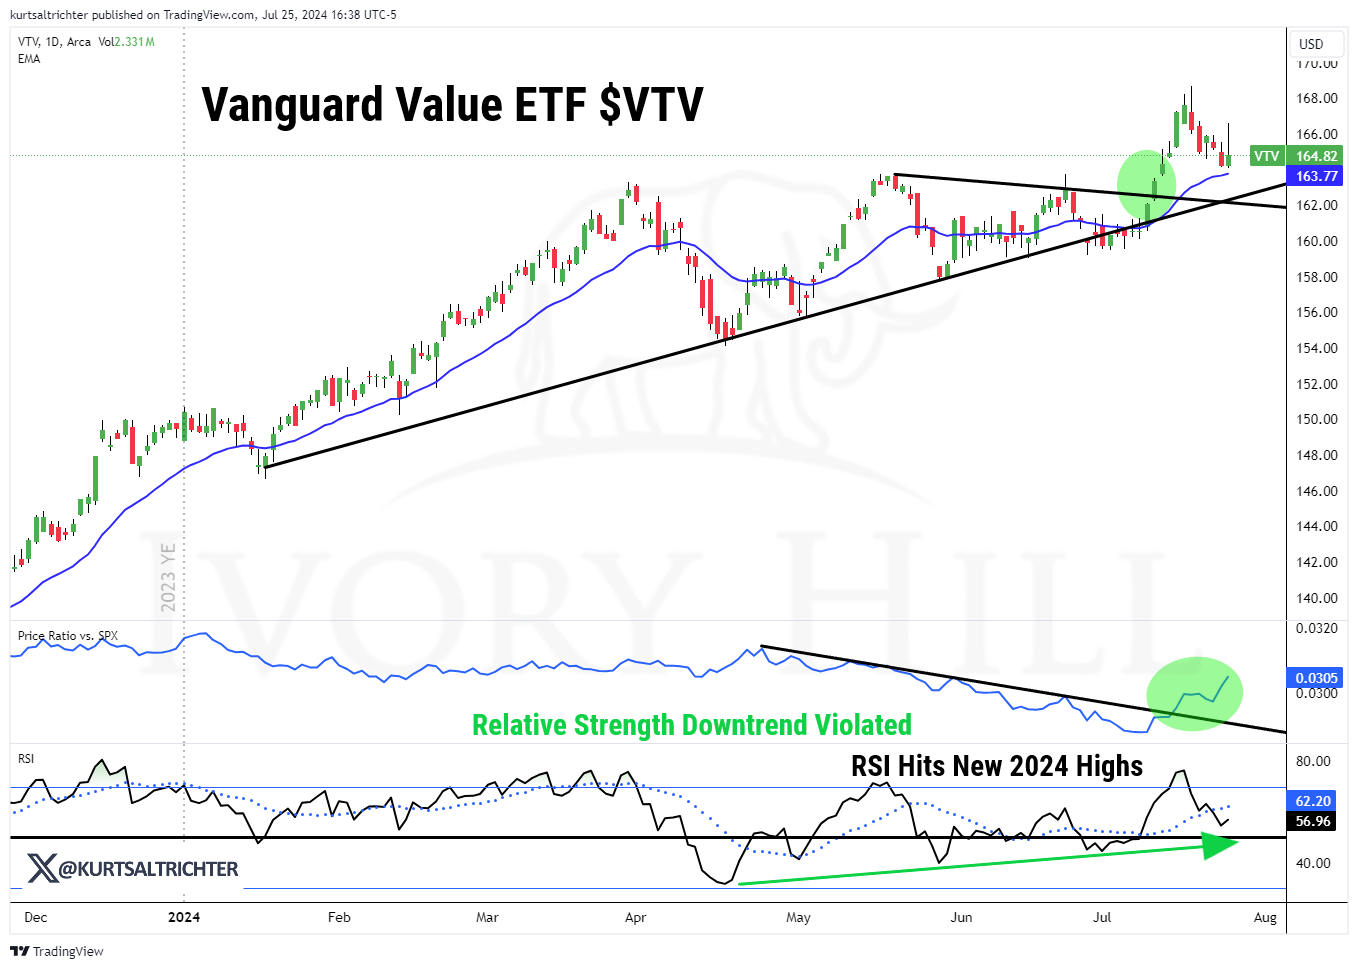
And value stocks are in.
This is likely a buy-the-dip opportunity for the S&P 500 and value stocks in general. While market rotation can be painful, I've learned not to chase it because it can often be a fake-out. I prefer to wait for confirmation rather than engage in bottom fishing and risk seeing the market drop another 10-20%. Is anyone looking at the yield curve?
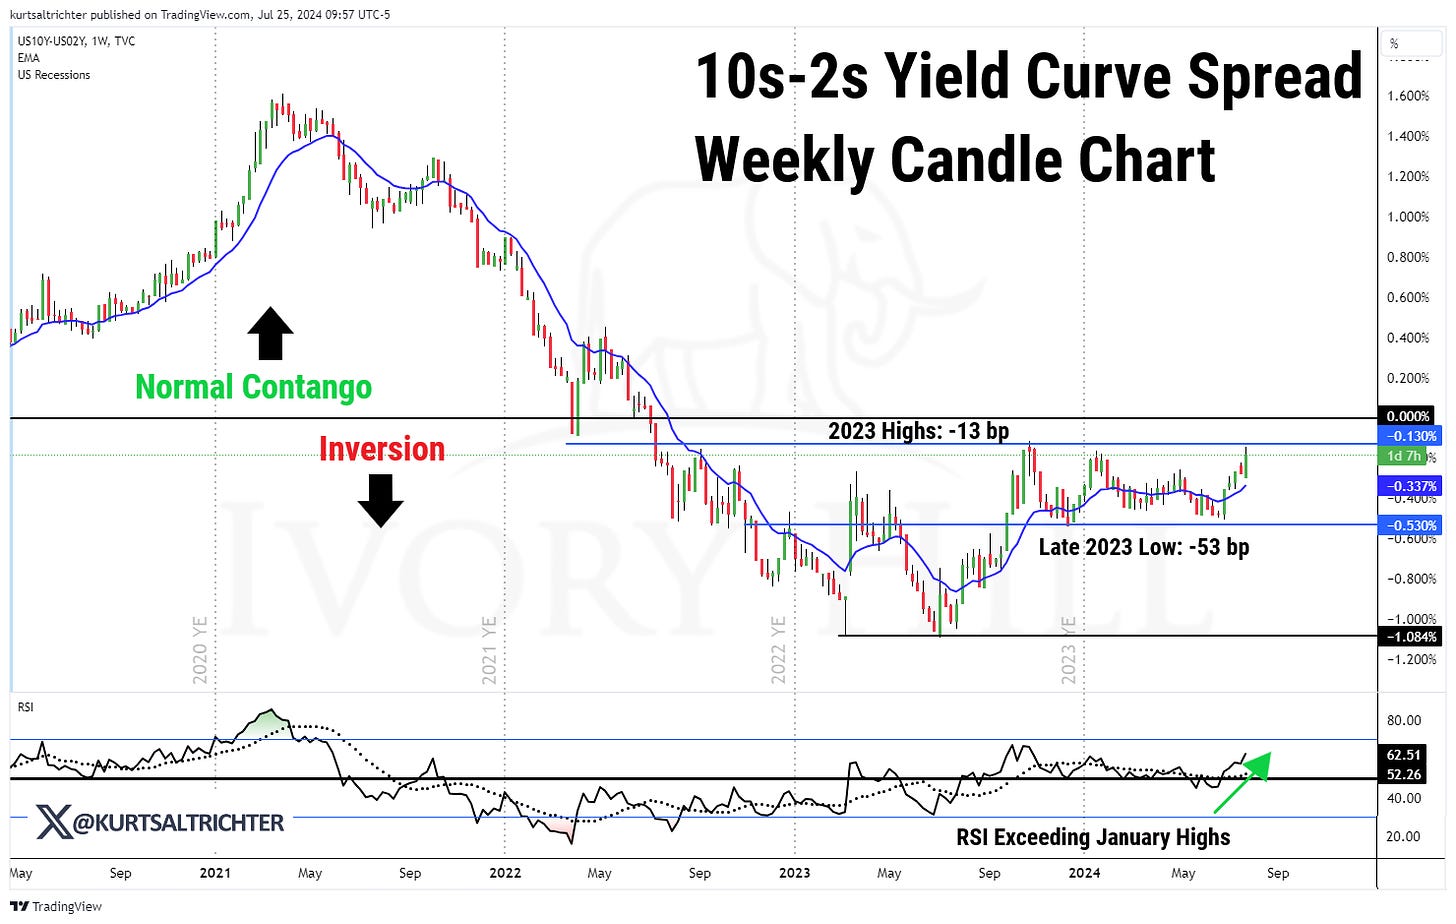
The 10s-2s spread has just reached a two-year high and is on the brink of turning positive. This week, the 10-year Treasury yield saw a modest increase. Despite mixed economic data, the 10s-2s yield spread tightened to -15 basis points, the highest since July 2022, and is steadily approaching positivity.
Over the past few years, I've consistently emphasized that this scenario sets a concerning precedent for the stock market. Historically, the last two times the yield curve inverted for this long and then turned positive, the S&P 500 plummeted by over 30% and took more than five years to recover to new highs.
While the 10s-2s yield spread nearing positivity isn't a sell signal by itself, the historical context demands heightened vigilance and a thorough review of portfolio volatility. Remember, this move depends on a multitude of factors, and if the yield curve turns positive, we are not moving to 100% cash, but it will definitely be a factor in how much risk we choose to take on. It could take months for stocks to roll over, or it could be starting right now. The thing about crashes is you don’t know you're in one until after it happens. Our long-term signal is green so we are not sounding the alarm just yet. Anything can happen in this market and political environment. We are committed to sticking to our rules-based approach.
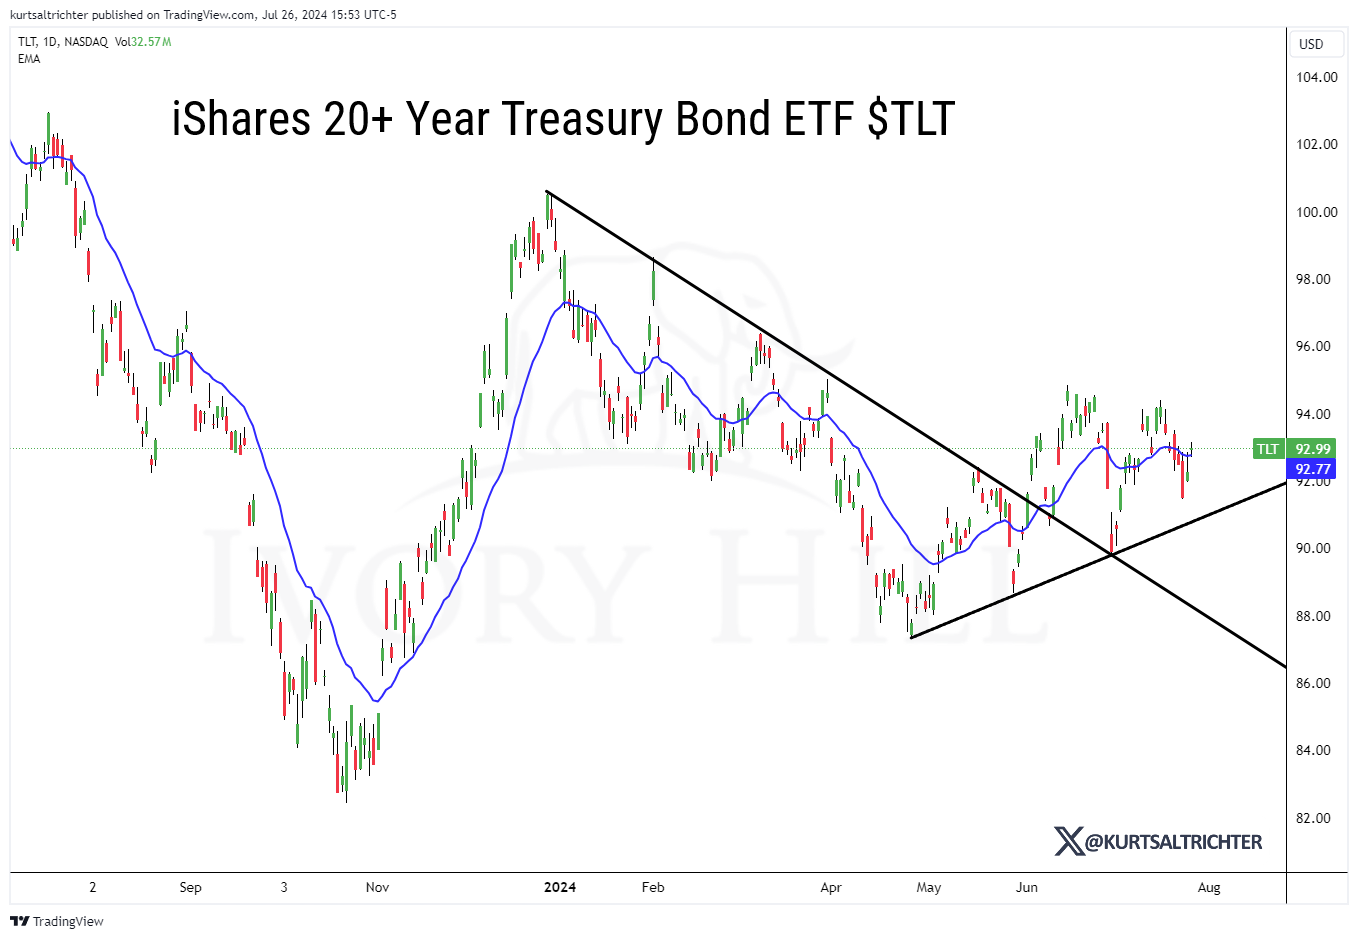
The 20-year Treasuries were in a clear downtrend, but the news that inflation is softening is now being reflected in bonds. TLT broke above its resistance line and is now forming a series of higher highs and higher lows. It's early, but everyone should keep a close eye on the bond market, as it will likely provide significant insights into the direction of inflation.
Is the Yen Carry Trade Unwinding?
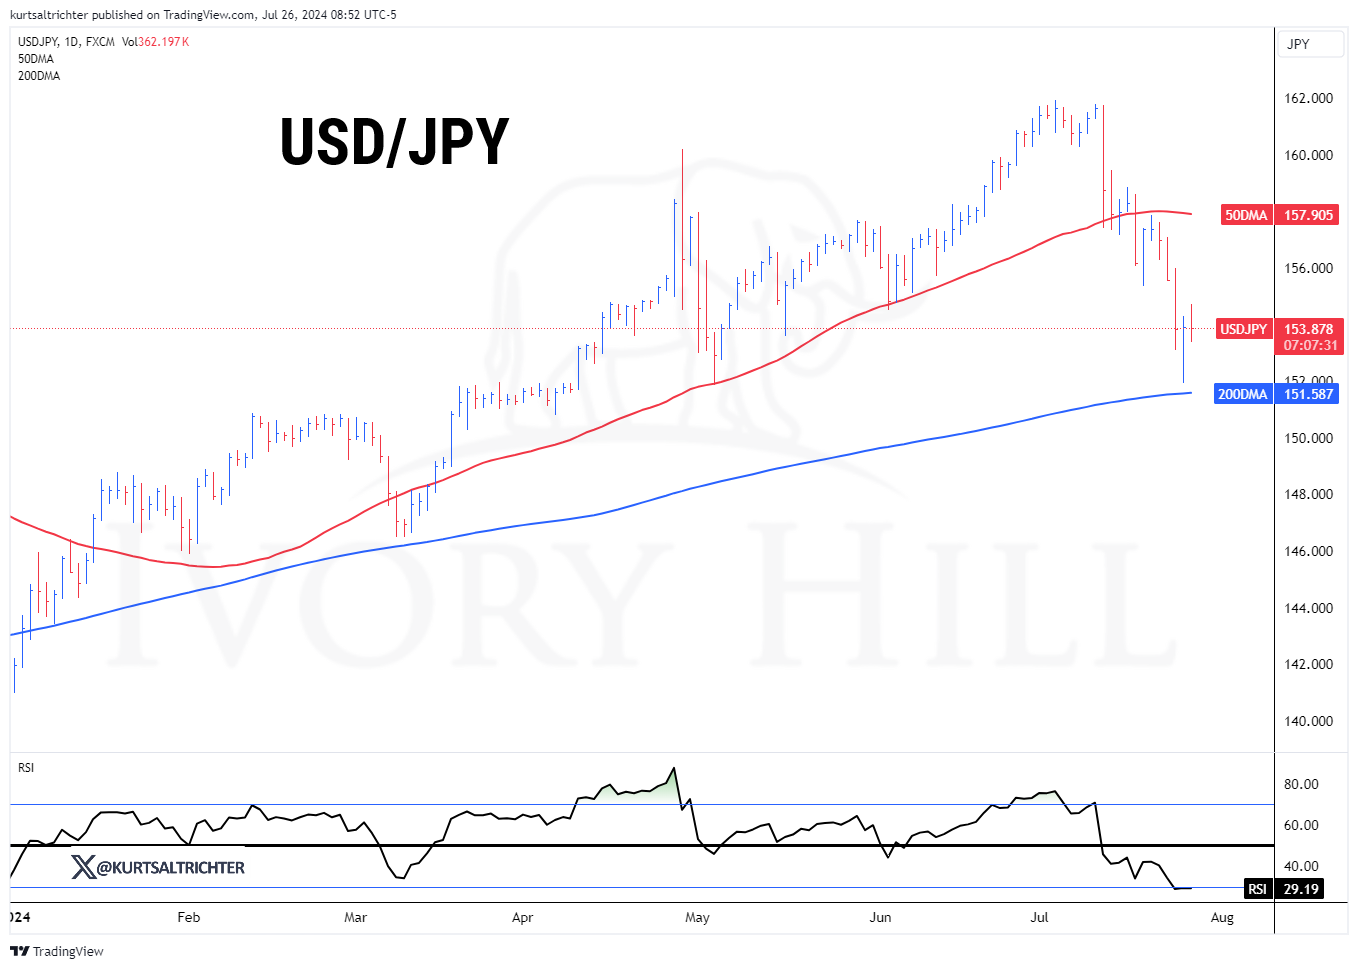
While the yen carry trade is not yet unwinding, it’s something to watch closely. The yen has strengthened over 5% against the greenback in the last month, primarily due to BOJ intervention. This strength is likely to have a mild impact on risk assets.
Key Technical Levels To Watch: The 200-day moving average (DMA) for the yen is around 151.60. Yesterday, the yen closed just under 154. Breaking this 200DMA could trigger a partial unwind and increase market volatility. I've set alerts on this level, and if it breaks, you'll be notified. You can read more of my analysis in this X thread I published this morning.
And remember - The one fact pertaining to all conditions is that they will change.