We’ve all heard the expression, “Buy low, sell high.” But that doesn’t mean we really know what “low” or “high” actually are… or what they have been historically. Therefore, to better define these vague terms, I pulled stock market data from the last 70 years, and then examined the average investment results that each valuation level would have produced over the following 10 years.
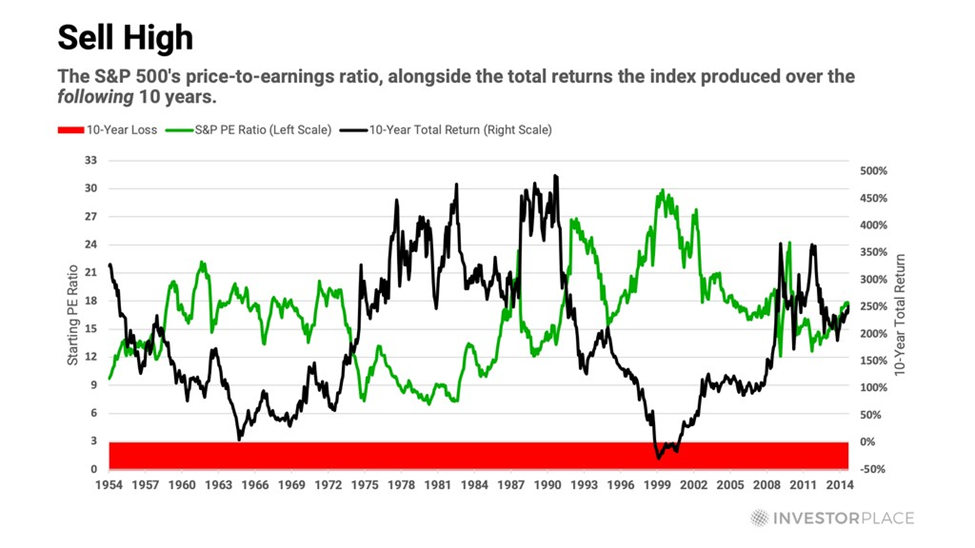
Since 1953, the S&P 500’s price-to-earnings (P/E) ratio has averaged 17.1. The lowest recorded P/E ratio during that span was seven, in 1980. The highest was 30, in 1999.
Not surprisingly, based on this multi-decade data series, lowly valued stocks tend to produce strong returns, and highly valued stocks tend to produce poor returns. The chart below illustrates this tendency.
In 1999, for example, as the dot-com bubble was reaching its peak, the blue line that tracks the S&P 500’s P/E ratio hit a then-record high of 30. The black line shows that stocks produced a loss over the subsequent 10 years.
Conversely, during the depths of the hyper-inflationary era of the early 1980s, the blue line that tracks the S&P 500’s P/E ratio hit a record-low of seven. The black line shows that stocks produced a gain of more than 400% over the subsequent 10 years.
Of course, it is not surprising that buying stocks at high valuations is less rewarding than buying them at low valuations, but the massive span between those divergent outcomes is somewhat surprising.
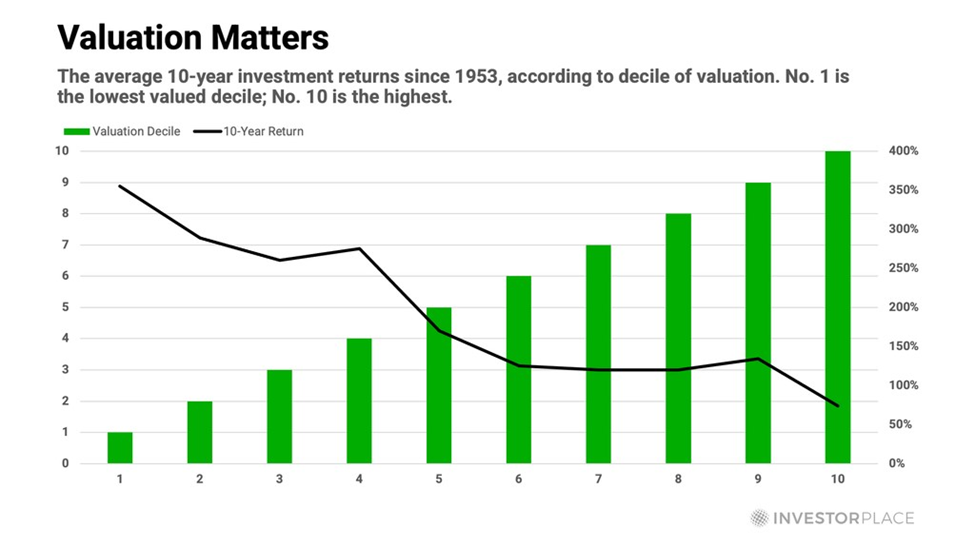
The chart below underscores that point by showing the average 10-year returns that resulted from buying stocks at each of the 10 deciles of valuation since 1953.
For example, the No. 1 decile (on the left of the chart) contains the lowest 10% of month-end P/E ratios since 1953. No. 2 contains the second lowest… and so on. No. 10 contains the highest 10% of P/E ratios.
As you can see, the lower the P/E ratio, the higher the following 10-year returns tend to be. That’s why decile No. 1 has produced an average 10-year return that is five times greater than what decile No. 10 has produced.
At 26.4 times earnings, today’s P/E ratio is not merely in the highest decile since 1953; it is in the highest half of the highest decile, which is especially foreboding. When stocks have traded at that level, or higher, they have produced a 10-year gain only 27% of the time, which means they have produced a 10-year loss 73% of the time.
For example, during the peak years of the dot-com boom, the S&P 500 P/E ratio never fell below 25.7. Every month-end P/E ratio from November 1998 to September 2000 was higher than that level… and every single one of those month-end “starting points” would have produced a loss during the following ten years.
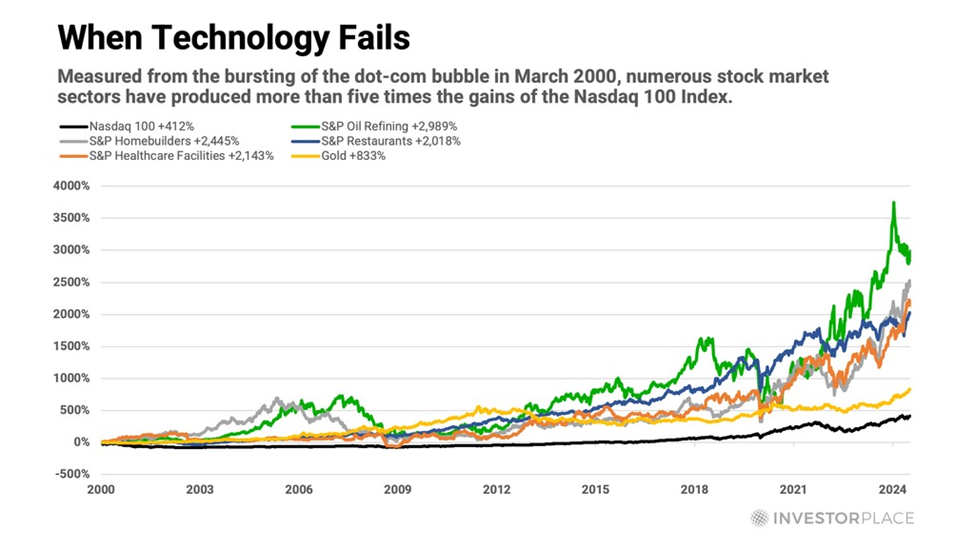
The technology sector reached even crazier valuation extremes during the dot-com bubble. At the precise peak in March 2000, the tech-centric Nasdaq 100 Index was trading for 81 times earnings!
When you pay those kinds of prices, you’re making a big bet against history that your investments will excel. Within one year of that peak, the Nasdaq 100 Index had tumbled more than 70%, and it would remain a losing investment for the next 15 years! On the other hand, any investor who paid that peak price in March 2000, and held on until today, would have reaped a gain of nearly 414%, or 6.9% per year. That’s not an entirely awful long-term result, but many other sectors delivered results over that timeframe that were more than five times greater. Even gold trounced the Nasdaq 100, by soaring more than 800% since March 2000.
Like I said before: Valuation matters.
Knowing that, and knowing that history is not on the side of richly priced stocks, how can we best prepare our portfolios to survive and thrive in the coming years? What proactive measures, if any, can we take to improve our odds of success?
To begin answering these vital questions, I’ll offer a two-part response…
Raise cash opportunistically
Become increasingly selective about new investments
The Value of Cash
Sometime cash feels like a cop-out – the thing you stash away when you can’t think of anything better to do. But cash can become a superpower when stock prices are falling.
For that reason, I recommend raising cash, here and there, when valuations are lofty as they are today. I’m not suggesting a complete portfolio liquidation or anything like that; I am merely suggesting that you raise cash opportunistically by selling into strength, or trimming positions.
To be clear, this research service is dedicated to highlighting superior investment opportunities, not to market-timing. So, I’m not recommending any market-timing today. I’m merely taking a moment to remind ourselves of what we already know: The only way to have cash available when stocks prices are low is to raise cash when prices are high.
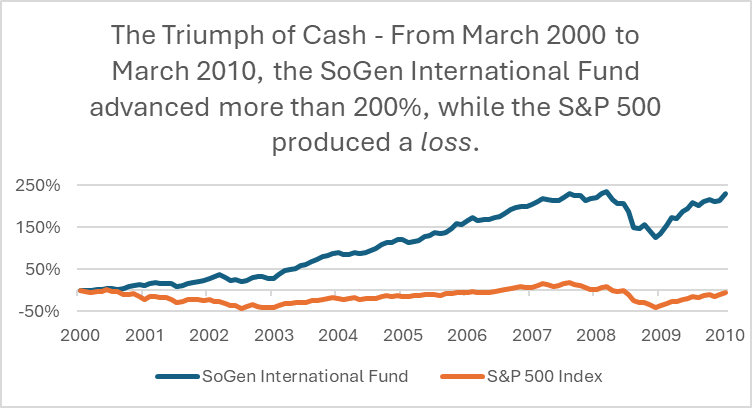
Perhaps no investor’s career demonstrated the awe-inspiring power of cash – and patience – better than Jean-Marie Eveillard’s. During the late 1990s, Eveillard was running the SoGen International Fund (now called the First Eagle Global Fund).
He had been a supremely successful investor with an enviable track record. But as stocks soared ever higher during the dot-com bubble of the late 1990s, the SoGen fund lagged far behind.
From the beginning of 1997 to the end of 1999, the S&P 500 more than doubled while the SoGen fund advanced just 29%. A large allocation to cash and precious metals weighed down results.
Some folks started to wonder if Eveillard had lost his touch.
Many of his shareholders scorned his “excessive prudence” and started withdrawing from his fund. But Eveillard was resolute. While many investors were piling up cocktail-party tales of investment success, Eveillard was piling up cash.
At the peak of the dot-com bubble, he defiantly remarked, “I’d rather lose half our shareholders than half our shareholders’ money.” And that’s exactly what happened: Disgruntled investors withdrew from his fund, and Eveillard lost half his shareholders.
But when the tech bust finally, and inevitably, rolled around, he did not lose half his shareholders’ money.
It wasn’t easy going for Eveillard at the time.
For three long years, it looked like his illustrious career might end in disgrace. His fund nearly closed down. But as it turned out, Eveillard’s prudence was, in fact, prudent.
In the 10 years from March 31, 2000, to March 31, 2010, the S&P 500 Index produced a negative total return. Over the same time frame, Eveillard’s SoGen International Fund more than tripled!
Instead of spending a decade recovering from severe losses, Eveillard was able to pile up fresh gains. As his gutsy move demonstrates, cash is not just the starting point of an investment. It is an investment in its own right.
To understand this concept, we must flip the typical view of investing on its head. Instead of looking at stocks as a certain quantity of dollars, let’s look at dollars as a certain quantity of stocks.
If I have a $100 bill and I wish to buy a $5 stock we’ll call “Stock X,” that bill is worth 20 shares of Stock X (i.e., $100 divided by $5). If that stock then doubles to $10, $100 of cash loses half its value, stock-wise. It is now worth just 10 shares of that stock. And if Stock X were to soar all the way to $100, that $100 bill would be worth just one share.
In other words, its value, measured in shares of Stock X, would have tumbled by 95% – from 20 shares’ worth to one share’s worth.
But the opposite is also true – and that is the key message about cash. When stocks are falling in value, a $100 bill is gaining in value relative to stocks. For example, if Stock X falls from $100 a share to $50 a share, the value of a $100 bill doubles.
So, cash isn’t simply an inert unit of measure. It is a unique asset which value increases when the prices of other assets are falling.
You can also see this idea at work in the commodity market.
In early 2008, copper was trading for more than $4 per pound. But once the financial crisis hit, copper prices plunged to $1.25 per pound. In other words, a $100 bill could have purchased 25 pounds of copper in early 2008 ($100 divided by $4), but 80 pounds of copper by the end of 2008 ($100 divided by $1.25).
Copper’s massive price decline increased the amount of this useful natural resource you could accumulate with your investment dollars. The metal’s price collapse from $4 a pound to $1.25 caused the value of a $100 bill, measured in copper, to appreciate by 220%.
When you understand that a bear market in stocks or commodities or real estate is a bull market in cash, you’ll be more comfortable keeping a large portion of your wealth in cash, knowing that its value increases when stocks fall.
You can start considering your cash as “returns in waiting.”
Most people panic during stock crashes and bear markets. But not investors who arm themselves with cash. They know that when asset prices go down, their power to accumulate assets goes up.
Nothing beats cash. It is the one and only vaccine against capital loss. Like all vaccines, it provides no visible therapeutic benefit. It simply repels harm and preserves your financial health.
Cash enables your portfolio to nourish itself on great investment opportunities, whenever they present themselves.