#NDX, monthly Think the market is oversold? Hardly so. The TSI has formed a massive bearish divergence and is about to trigger its first sell signal since the 2023 bull market began. The technical setup suggests significant downside potential remains. This isn't just a dip.
https://x.com/yuriymatso/status/1905680561907400844
#NDX, 1d Clear rejection.
https://x.com/yuriymatso/status/1905624164930830482
$SPY weekly bearish engulfing candle with the 75sma looking possible
https://x.com/Reformed_Trader/status/1905751766463033515
We were out of stocks since the beginning of this century which has been beneficial since gold has outperformed stocks even with dividends reinvested.
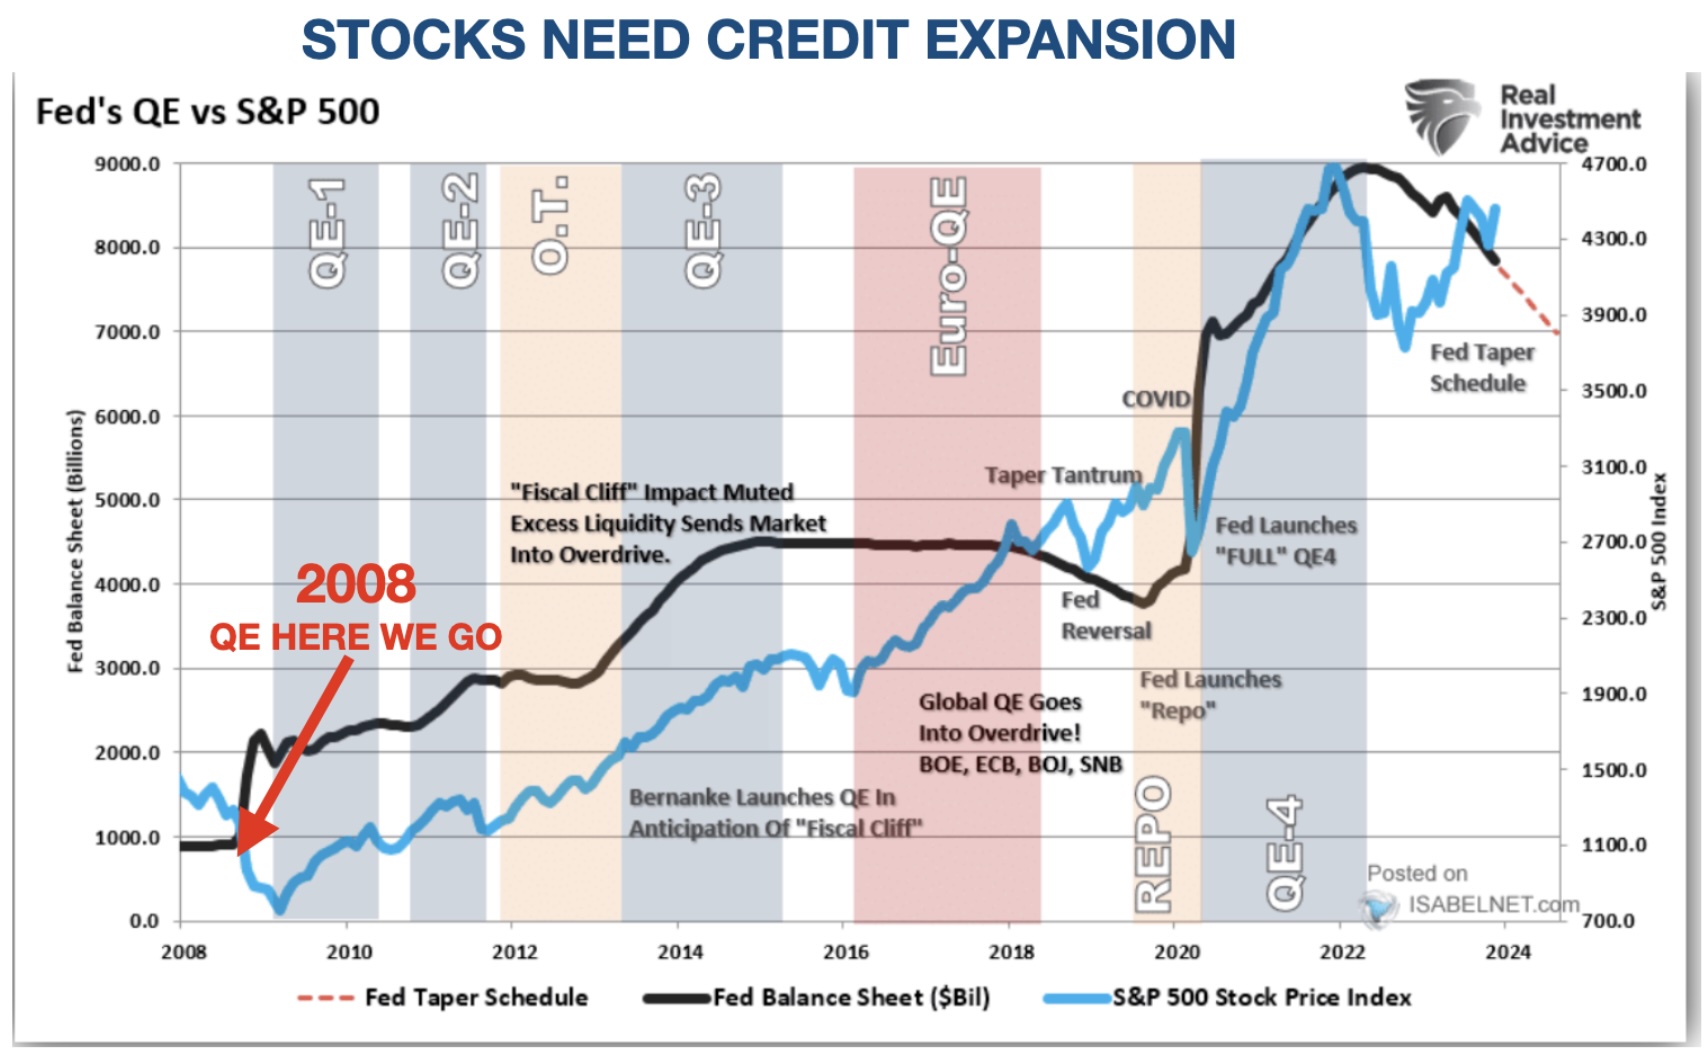
So, instead of a market collapse in 2008, massive money printing and credit expansion have created the biggest stock market bubble in history.
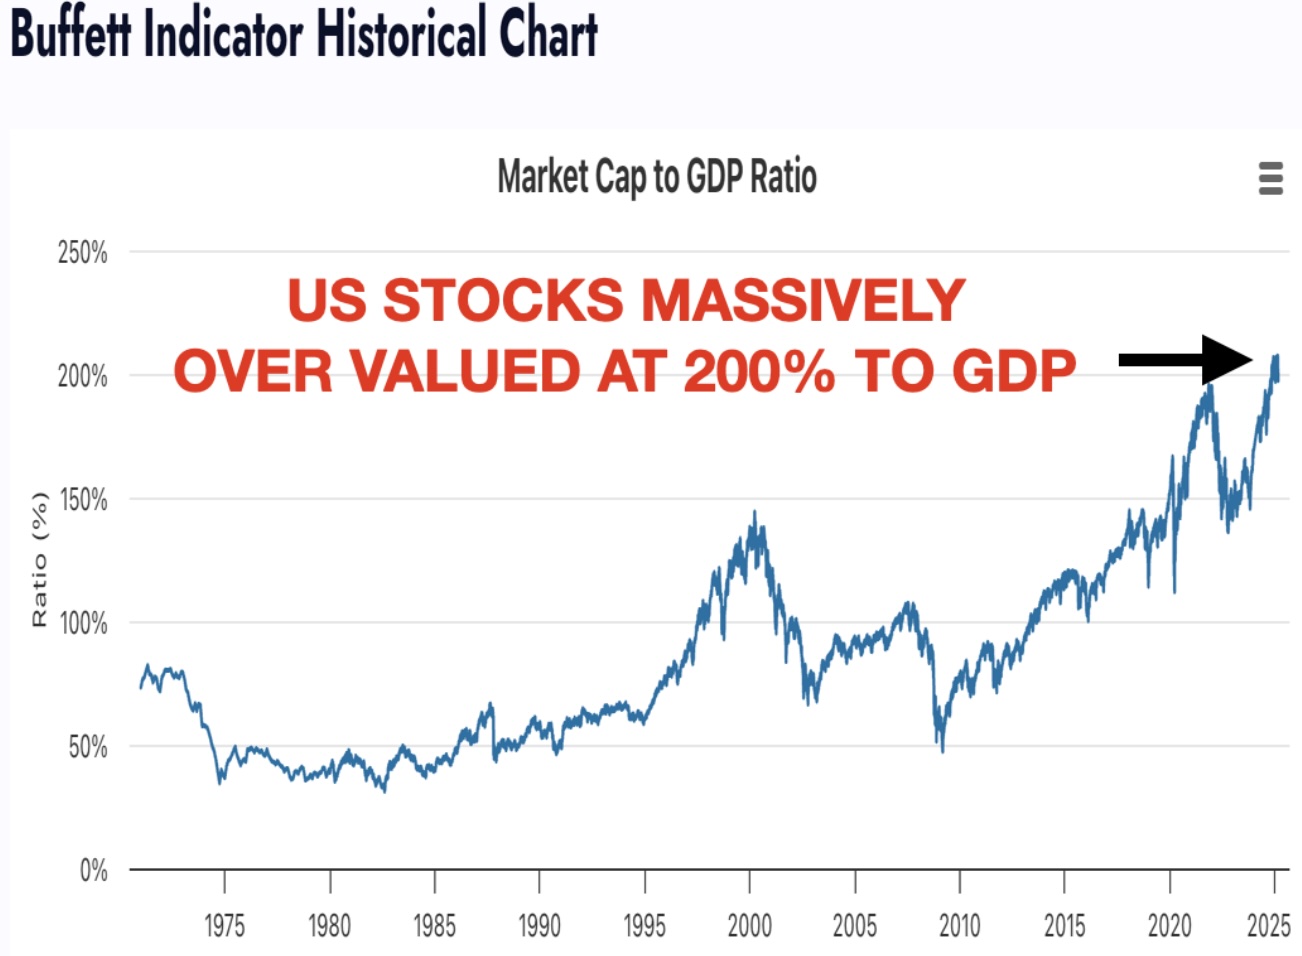
See the graph below of US Stocks to GDP. In the 2000 bubble top, Buffett’s indicator was “only”145%. That was when the Nasdaq fell 80%. Today, the US Stock-to-GDP is over 200%.
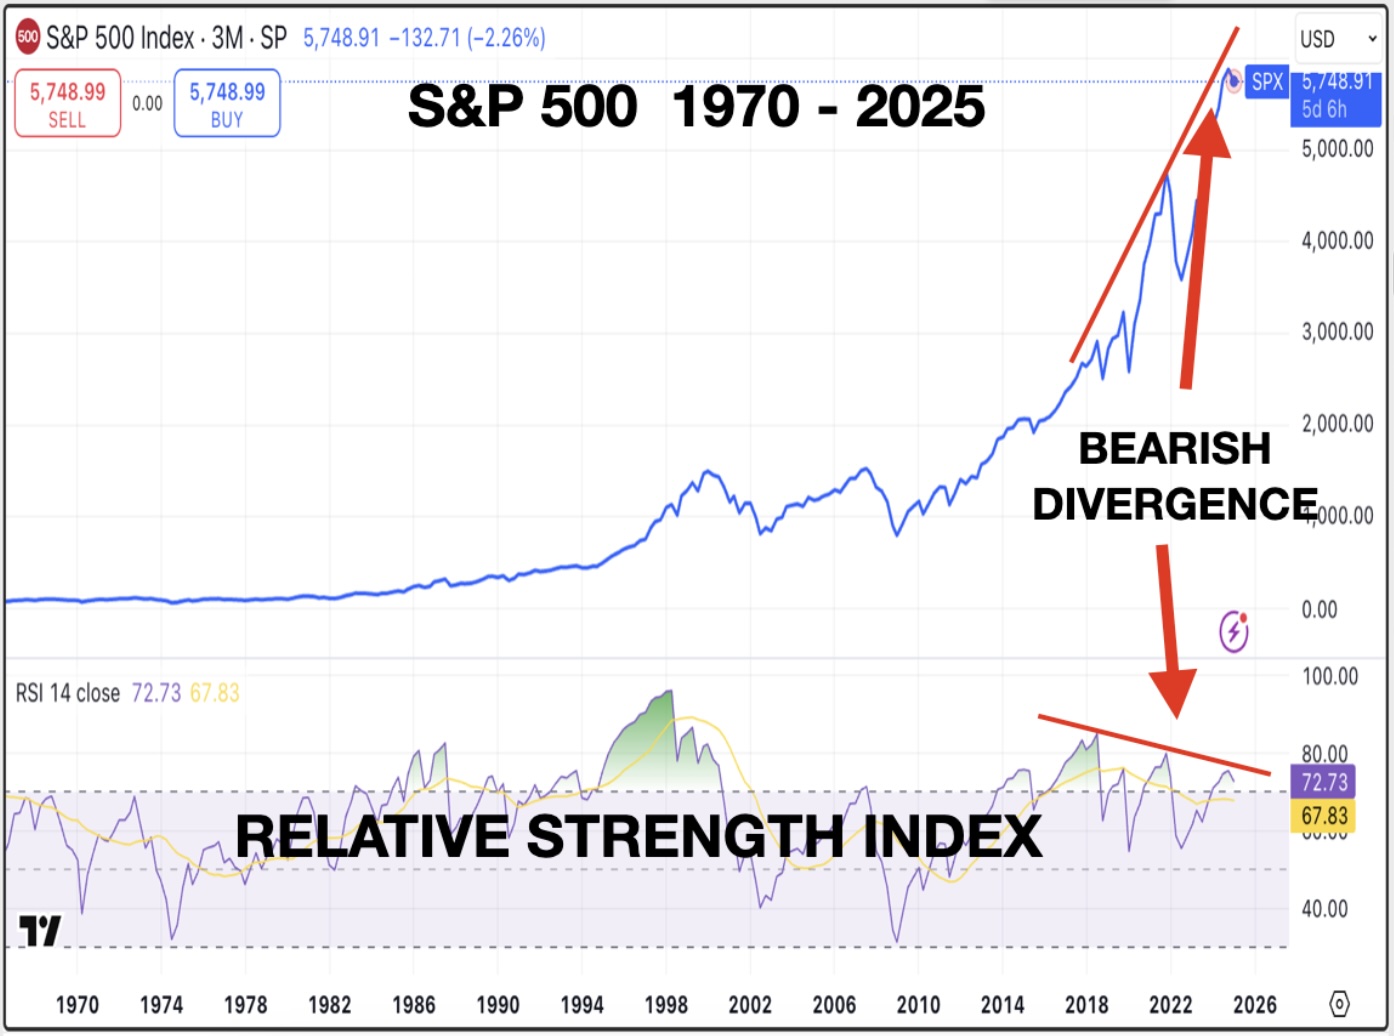
Another reliable indicator is bullish/bearish divergence. The S&P chart below shows a bearish divergence since 2018. This means that the Momentum indicator (RSI) has been showing lower tops since 2018 in spite of a much higher price. This is a very bearish long-term signal.
But back to “WHY WE HAVE FINALLY ARRIVED”.
So, I have just explained that gold (and silver) is about to accelerate.
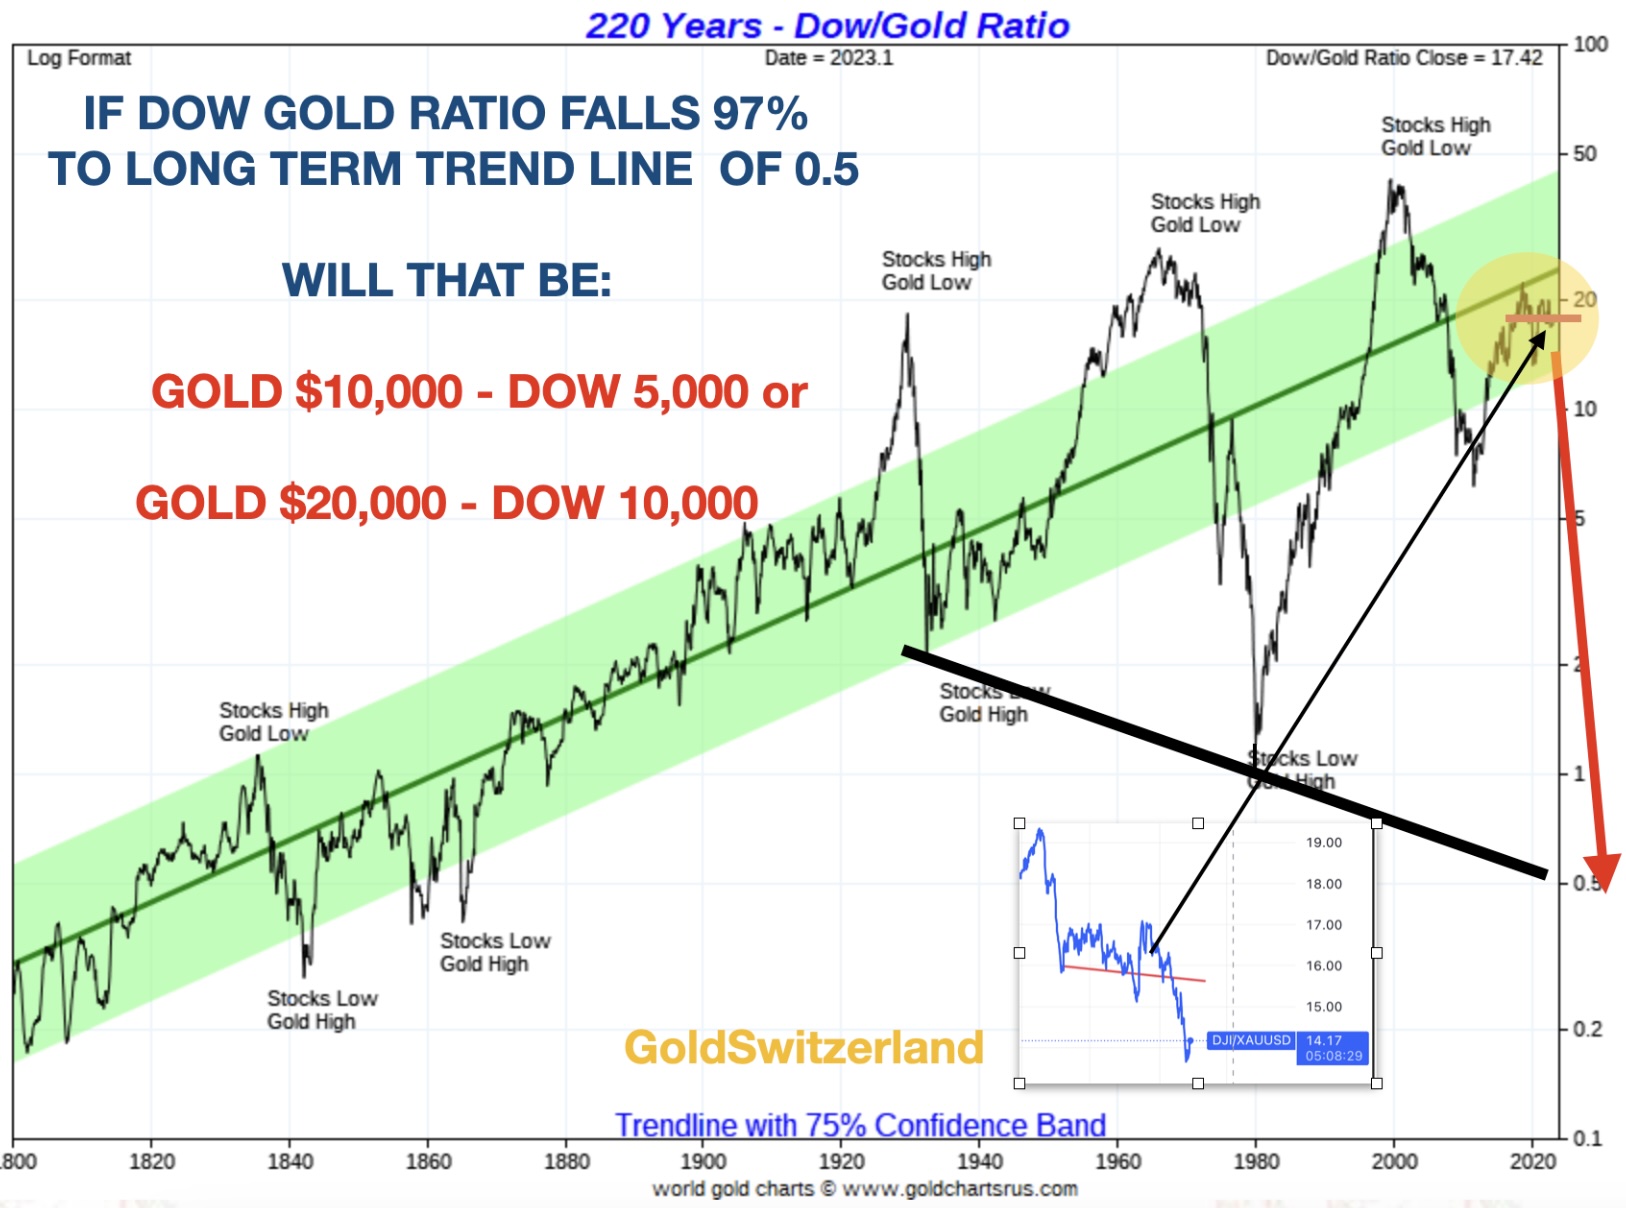
So, if we look at the Dow Gold Ratio (the Dow divided by Gold), back in the year 2000, the ratio was 45. It is now 14. The ratio has just broken a 12-month trend line and is now about to accelerate down.
This means the Dow has fallen 69% against gold in the last 25 years.
More importantly, if the ratio reaches long-term support at 0.5, it would mean a 97% fall from here. But I doubt it will stop there.
That could mean Gold $20,000 and Dow 10,000.
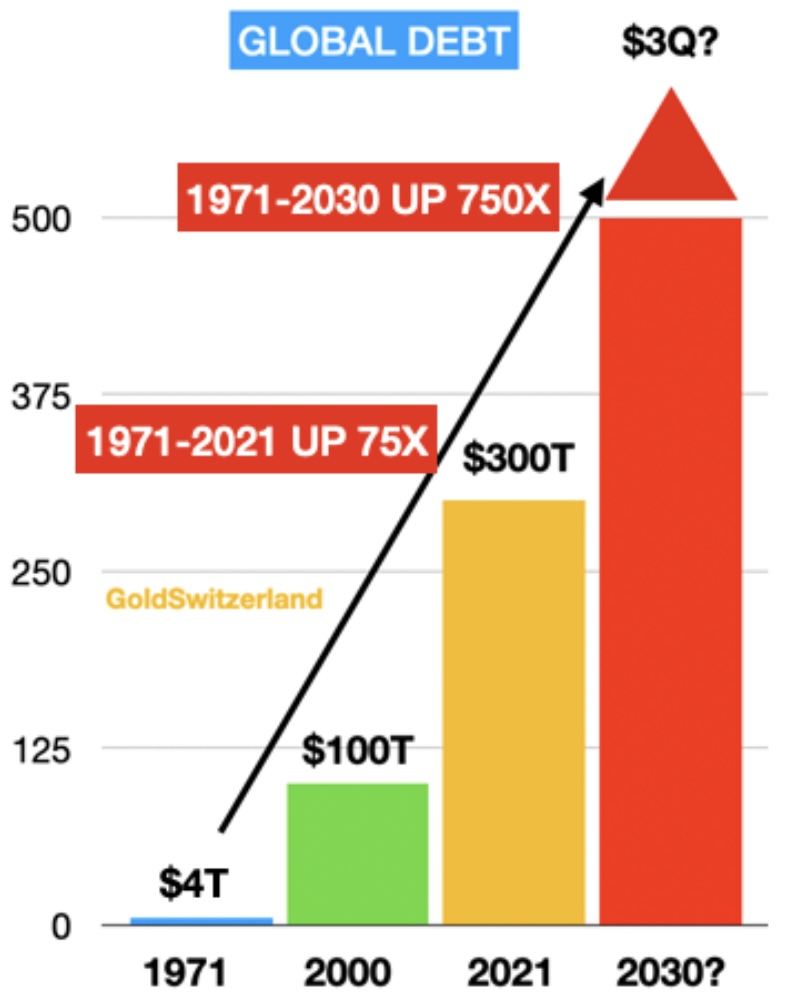
Since the 1990s, I have privately talked about the inevitability of a collapse of the current monetary system, just like every monetary system in history has collapsed, without exception. The simple reason is, of course, the exponential growth of credit.
As the graph shows, Global Debt grew 75 X from 1971 to 2021. Today, it is around $360T. But if we add unfunded liabilities and derivatives which is a form of debt (when the derivative market implodes), then total debt and liabilities are around $3 quadrillion.
BONFIRE OF THE PAPER ASSET VANITIES & THE REBIRTH OF GOLD
So we are likely to see a debt collapse with bonds crashing (rates up), banks “borrowing” or blocking client funds or governments forcing bank accounts to buy 100-year bonds at ZERO interest. And obviously, the dollar will fall precipitously.
At best, we will see a restructuring and, at worst, a collapse of the banking system.
Its Over, page-26047


Featured News
Featured News
The Watchlist
PAR
PARADIGM BIOPHARMACEUTICALS LIMITED..
Paul Rennie, MD & Founder
Paul Rennie
MD & Founder
SPONSORED BY The Market Online