Friday's gold price action has been more encouraging than in the past 2 weeks and if we get past $1970s and stay there for awhile longer, there is good chance we could test $2000.
You just have to see the USD/JPY chart, USD is dropping against the Yen , thats a good sign for gold. And the past week's lower movement against the previous weeks uptrend has made that difference. It’s Go Time for Gold! Next Stop $2,250
Our Adaptive Fibonacci Models suggest support will prompt new Gold rally to $2,250.
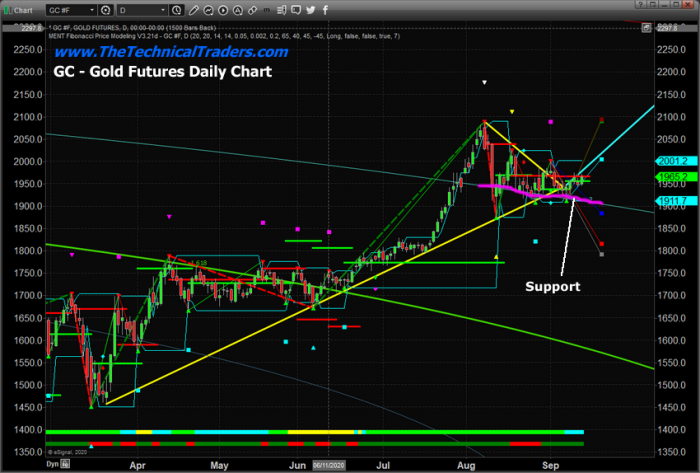
Gold Pennant/Flag formation is now complete and setting up new momentum base near $1,925.
Our Adaptive Fibonacci Models suggest support will prompt new Gold rally to $2,250.
The rally in Gold will continue to extend higher over the next 4+ weeks.
The US Dollar may move lower and/or the US stock market may break recent support to prompt this new rally in Gold.
If you are a follower of my research, then you know I follow gold and silver closely. I believe Gold has completed a Pennant/Flag formation and has completed the Pennant Apex. Further, a new momentum base has setup near $1,925~1,930, near the upper range of our Adaptive Fibonacci Price Modeling System’s support range. My team and I believe the current upside price move after the Pennant Apex may be the start of a momentum base rally targeting the $2,250 level or higher.
MOMENTUM BASE SHOULD PROMPT +15% RALLY IN GOLD
We believe the current momentum base in Gold, near $1,925, will prompt a move higher that will initially target $2,100, then breach this level and attempt to move to levels near $2,250 fairly quickly. My research team and I have called nearly every upside price move over the past 6+ months, clearly and accurately describing the “measured moves” in precious metals.
This Daily Gold chart above highlights our Fibonacci Price Amplitude Arcs, suggesting support is sloping downward near $1,915 right now. We believe the momentum base that is setting up after the Pennant Apex is just starting to build upside momentum. We believe the rally in Gold will continue to extend higher over the next 4+ weeks. This aligns with our Fibonacci Price Modeling System’s support range on the Weekly chart, which we will look at shortly.
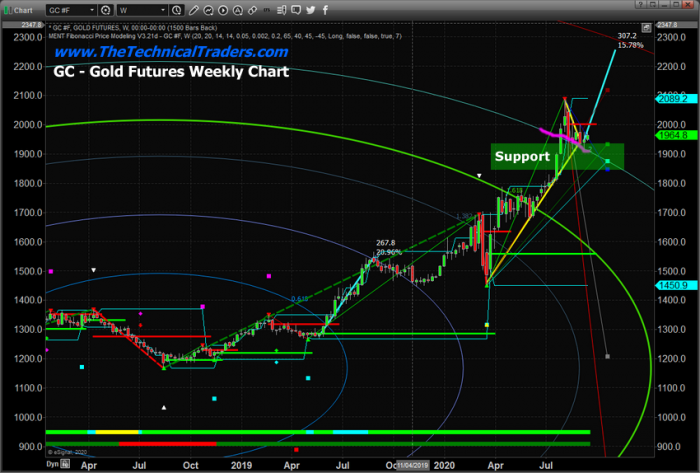
The Weekly Gold chart, below, highlights the Pennant/Flag formation in YELLOW together with the Fibonacci Price Amplitude Arc support levels (in MAGENTA). Additionally, we’ve drawn a LIGHT GREEN rectangle through the support range identified by our Adaptive Fibonacci Price Modeling System. We believe this support range will continue to act to support the momentum base in Gold and push Gold prices higher once the upside momentum gains strength. Our upside price target is more than $300 higher than the current price levels. We believe the next upside price leg will target $2,250 or higher.
It is likely that this move in Gold will be associated with moderate risk factors related to the US Dollar and/or the US Stock market. We believe a lower US Dollar and/or a weakening US stock market that breaks recent support will lick start this new rally in Gold. Now is the time to really start to pay attention to how the US stock market holds up after the deep downside price rotation over the past 2+ weeks, and start positioning for a gold rally.
Chris Vermeulen
Chief Market Strategist
Technical Traders Ltd.