...staying sidelined while the markets make new highs can be a difficult discipline ...that was what I did in late stages of the Q4 2020 bull market rally....and this is what I am doing this time as well.
A historic level of tension
There has been tension between the main focal points of our work for months now. In almost 20 years of publishing, this tension has never been so pronounced, or so prolonged.
Jason Goepfert
Published: 2021-04-07 at 09:00:00 CDT
Our main focus is sentiment. While there are always odd outlier indicators, there is little question that starting in December and arguably continuing today, we're seeing some of the most speculative behavior we have in a generation.
Another main focus is breadth and momentum. Those two forces are the main opposition to sentiment extremes, and when they are of high quality, they can swamp sentiment extremes for long stretches.
We've been watching carefully for months to see if the extremes in sentiment would lead to a deterioration in participation among stocks and bonds underlying the main indexes. So far, there have been only isolated pockets, and just when it seems like we would get major warning bells, the market recovered.
And how.
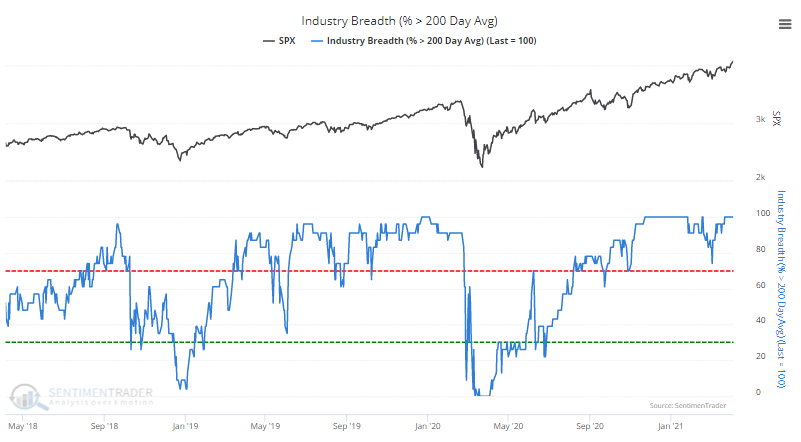
We track some unique breath measures, not only looking at stocks within indexes but also indexes within groups. And in the past couple of days, those have reached near-record impressiveness. Among industries, sectors, and global indexes, we are now seeing among the best participation on record.
This is judged by 4 positive metrics, like the percentage of indexes above their 200-day averages, and 3 negative ones, like the percentage of indexes at 52-week lows.
The positive ones are all very positive, and the negative ones are almost nonexistent. For example, 100% of major industries are trading above their 200-day averages.
If we average all the positive metrics and subtract the negative ones, then we can get a breadth aggregate. For the 20+ major industries in the U.S., this aggregate just hit +80, among the highest readings in 30 years.
...staying sidelined while the markets make new highs can be a...


Featured News
Featured News
The Watchlist
NUZ
NEURIZON THERAPEUTICS LIMITED
Dr Michael Thurn, CEO & MD
Dr Michael Thurn
CEO & MD
SPONSORED BY The Market Online