Gold inching ever upwards, a northbound trajectory in progress and slow and steady is the way I like it.
Last evening I mentioned that there is more conviction coming into play in gold stocks while the general equities market is inching higher but with seeming wariness. Last week I also mentioned that this week could be the last week for opportunity in the gold space, because October month is approaching. October begins with Oct 1 China Communist Party celebration, they could get more cavalier after that, European growth is clearly stagnating and pointing south and 31 Oct Brexit outcome could make that worse and of course everyone is anxiously waiting for that US-China trade negotiation summit after the first week of October.
The gold majors are heading higher today led by KLA, no surprise there.
Column 1
Column 2
Column 3
Column 4
Column 5
0
GOLD WATCH
13/9/19
24/9/19 arvo
%Chg
1
GOLD USD/OZ
1,496
1,520
1.6%
2
GOLD AUD/OZ
2,178
2,246
3.1%
3
1
GOLD [BETASHARES ETF]
$ 205.04
$211.21
3.0%
4
2
NORTHERN STAR (NST)
$ 10.23
$ 11.65
13.9%
5
3
EVOLUTION MINING (EVN)
$ 4.54
$4.80
5.7%
6
4
SARACEN (SAR)
$ 3.28
$3.61
9.9%
7
5
GDX (VAN EYK GOLD ETF)
$ 39.67
$ 42.90
8.1%
8
6
CHALICE GOLD MINE (CHN)
$ 0.19
$ 0.225
21.6%
9
7
BLACK CAT SYNDICATE (BC8)
$ 0.47
$ 0.485
3.2%
10
8
CATALYST METALS (CYL)
$ 2.32
$2.53
9.1%
11
9
WESTGOLD RESOURCES (WGX)
$ 2.51
$2.50
-0.4%
12
10
KIRKLAND LAKE GOLD (KLA)
$ 67.21
$ 73.25
9.0%
13
11
ALKANE RESOURCES (ALK)
$ 0.780
$ 0.815
4.5%
14
COMPOSITE RETURNS excl SPECS TO DATE
7.96%
15
1
ORA GOLD (OAU)
$ 0.016
$ 0.016
0.0%
16
2
METEORIC RESOURCES (MEI)
$ 0.070
$ 0.061
-12.9%
17
3
SPECTRUM METAL (SPX)
$ 0.086
$ 0.082
-4.7%
18
COMPOSITE RETURNS TO DATE
6.81%
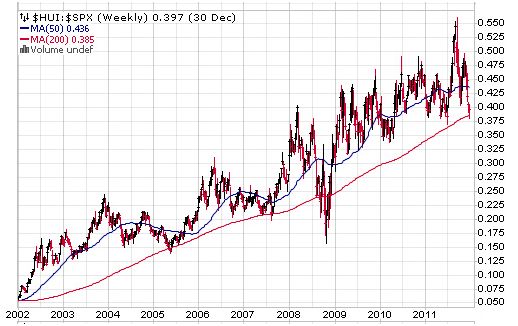
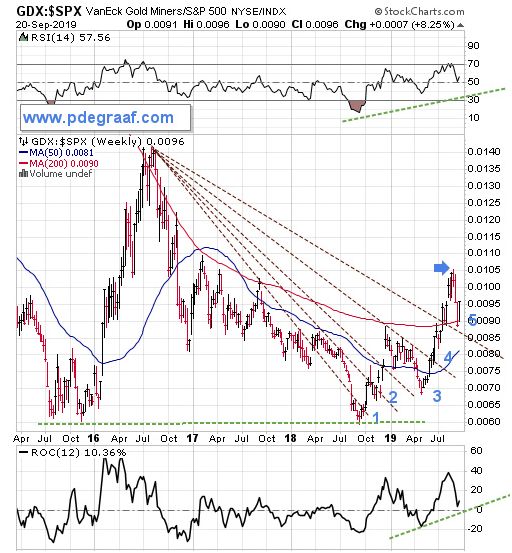
This article below underscores the relative outperformance of gold majors against the SPX (US equities) , outlining a bullish trend that has already commenced and under way.
Long term trends take a long time to reverse. One such trend compares gold mining stocks to the S&P 500 stocks. From 2002 until 2011 gold mining stocks outperformed generic stocks, as can be seen in the following chart. (Charts courtesy Stockcharts.com).
The trend unmistakably featured mining stocks ($HUI) over the S&P 500 stocks. From 2011 until recently, the trend reversed, putting Wall Street back in the lead. Our next chart shows that we may be about to see a trend favoring miners again.
Featured is a chart that compares gold producers (GDX) to main stream stocks ($SPX). The fan blades highlight incremental breakouts that show miners are outperforming generic stocks. Breakout #4 inched above the 50 week moving average (blue line), #5 closed above the 200 week moving average (red line), for the first time since 2016. The blue arrow points to the spot where another fan blade is likely to be drawn. The moving averages themselves are rising for the first time in years! Seasoned observers consider this a very bullish setup, resulting in money leaving generic stocks and moving into the gold sector!
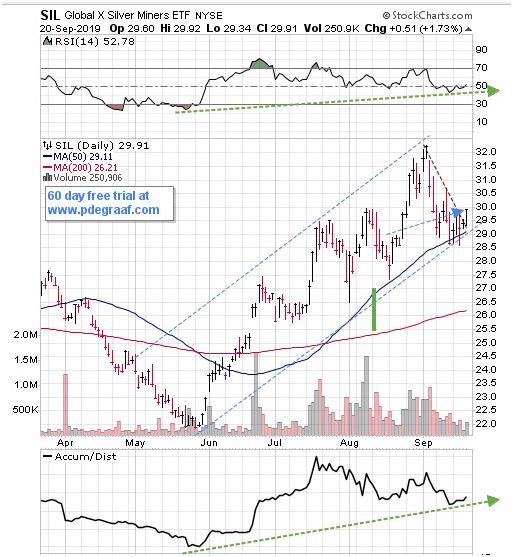
Not to be overlooked is the silver producers sector, represented here by a chart of SIL the silver producers ETF. Silver usually outperforms gold during a bull market, and SIL is breaking out from congestion, within the rising blue channel. A close above the blue arrow will confirm the breakout, which could happen this week!.