Goldman's forecast just gets worse by the week, a 2000 pt on the S&P500 was also my projection but I did call 1500 if those factors as I laid out in my last post come true, and as for 3000 by the end of the year, that is way too optimistic. I suggest you look at prior market recoveries in my previous posts; the reason why Goldman forecast is so because no one at this stage want to suggest that the virus contagion would impair the credit markets - it is assuming central bankers have done enough and will do more and capable of addressing it. Let's hope so.
"The Speed Of Business Erosion Is Unprecedented": Goldman Sees S&P Dropping To 2,000, Cuts EPS By 33%
by Zero Hedge
Sun, 03/22/2020 - 16:20
We were curious what Goldman's hilariously optimistic market strategist David Kostin, who until Friday was confident that the S&P would still end the year at 3,200, would do with the news from his economist team that GDP in Q2 would fall by a depressionary 24%. We got the answer late on Friday when after two consecutive EPS cuts, Kostin published his latest Weekly Kickstart note with the appropriate title "The third cut is the deepest" in which he said that he is now "Slicing 2020 S&P 500 EPS forecast to $110, a 33% decline from last year."
Some more details on Goldman taking the proverbial machete to its EPS outlook:
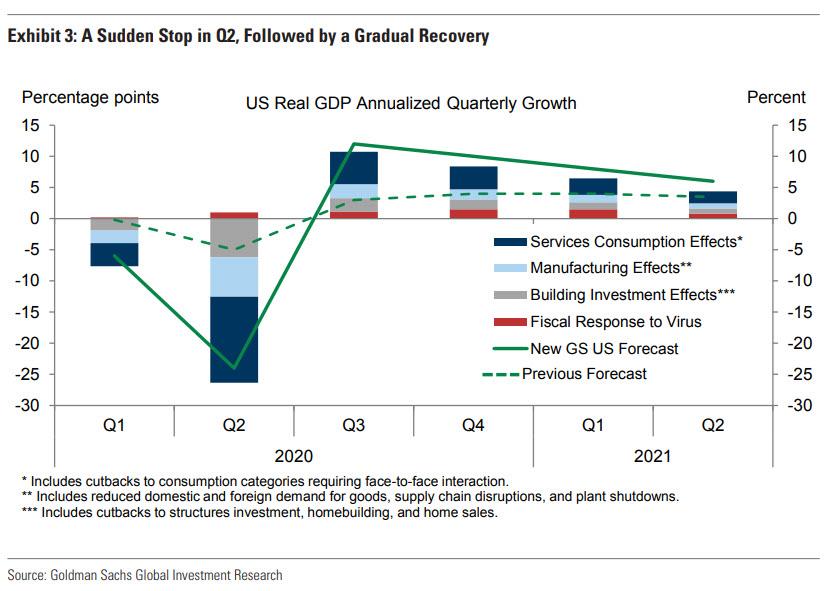
We now forecast S&P 500 EPS of $110 in 2020, a decline of 33% from 2019. On a quarterly basis, this reflects year/year growth of -15%, -123%, -21% and +27% (Exhibit 1).
We have cut our 2020 earnings forecast three times in 30 days (-37% in total) as the magnitude of the economic slowdown has become increasingly apparent. Our economists have incorporated similar expectations into their revised annual average US GDP growth forecast of -4% in 2020, including –24% annualized growth in 2Q. At the sector level, we expect large declines in Energy, Consumer Discretionary (e.g., Cruises, Hotels, Restaurants), and Industrials (e.g., Airlines). On the other hand, stockpiling may partially insulate Consumer Staples EPS.
Of course, it is easy to mock Goldman's chronic optimism - which for the past decade has failed to aknowledge the explicit role of central banks in keeping this historic asset bubble inflated - what we find even more amusing is Kostin's shock at how quickly market, and for that matter society, appears to be unwinding:
It is incredible how much can change in one month. On February 19th, the S&P 500 reached an all-time high of 3386, Senator Bernie Sanders was the front-runner to win the 2020 Democratic nomination, and investors were evaluating the extent to which the novel coronavirus would create supply chain disruptions. One month and one day later, the S&P 500 sits 32% lower, former Vice President Joe Biden has a large delegate lead, and people around the world are now isolated in their homes.
Each day contains a month’s worth of market news. Global monetary and fiscal policymakers have taken dramatic steps to arrest the economic devastation that is disrupting civilian life and business activity. Volatility has soared. In March, the typical daily move in the S&P 500 index has been 5%. US federal, state, and local governments have taken increasingly drastic measures to “flatten the curve” of new coronavirus cases. The list of travel restrictions grows almost hourly. California, home to 1 in 8 Americans, mandates people “stay-at-home.” NYC closed schools and restaurants and 100% of the non-essential workforce must stay at home.
Government measures taken to slow the viral spread have impaired near-term sales and earnings for many firms. As a result of the social distancing taking place across the US, many retailers have reduced store hours (WMT, TGT, and HD) or closed physical stores altogether (M, JWN, and KSS). Airlines have cut routes in response to low passenger demand and hotel occupancies stand at record lows.
Which brings us to the $64 trillion (soon to be quadrillion) question- how long will the pandemic last, how long will it keep the US economy effectively shut down, how long until there is a glimpse of a recovery, and finally, what that recovery will look like. Here's more from Kostin:
The key question now is “V” or “U” or “L”? Early in the correction, investors were focused on quantifying the downside risk to near-term earnings, but were confident that EPS growth and share prices would recover later in 2020. As the virus spread and its economic impact intensified, investors have been forced to grapple with whether the sharp decline in near-term activity will be followed by an equally sharp recovery (“V”, last multiple quarters before improving (“U”
Needless to say, for not Goldman remains firmly in the V-camp, in both its economic recovery forecasts, which see US GDP soaring 10% in Q3 (good luck with that)...
... as well as EPS with Goldman now expecting a full recovery by Q4 (expect this number to be revised substantially lower in coming days, if not hours). And as one would expect, Goldman's (slowly deflating) optimism now relies on just one core support pillar: more bailouts.
Policymakers have responded in force with startling speed. The Fed has slashed the policy rate effectively to zero and taken steps to boost credit availability, such as reintroducing the Commercial Paper Funding Facility (CPFF) backstopping corporate borrowing for terms out to 90 days. Our economists expect Congress and the Trump administration will continue to enact legislation that provides a fiscal boost of $1 trillion (5% of GDP) or greater.
Which brings us to Goldman's optimistic punchline:
If all goes according to plan, S&P 500 EPS will leap by 55% to $170 in 2021, and the index will end 2020 at 3000 (30% above the current level). Earnings and investor sentiment will be recovering later in 2020. Using the Fed Model, applying a Treasury yield of 1% and a yield gap of 465 bp, suggests a P/E multiple of 18x on 2021 EPS and a year-end 2020 level of 3000
If it does not all go according to plan, well... all bets are off. Meanwhile, traders have other things to worry about like what happens in the near term, and it is here that Goldman has some bad news:
In the near-term, we expect the S&P 500 will fall towards a low of 2000. The stock market is a leading indicator of business trends, and corporate activity continues to deteriorate with no signs yet of a bottom. The first quarter has not even ended and companies have yet to release 1Q results but equities have already collapsed by 32% in one month. The speed of business erosion is unprecedented.
Making matters worse, there is absolutely no visibility at this moment.
Understandably, many firms have withdrawn previously issued guidance. More will pre-announce in coming days. Revenues have dropped precipitously and firms face cash shortfalls. Ford (F) announced this week it will suspend its dividend. Other firms will likely follow its lead. More than 65% of S&P 500 market cap will report 1Q results during a concentrated 2-week period that is more than one month away (April 20-May 1). For most corporations, business was strong in January and the first half of February, weakened only towards the end February (coincident with the market peak), and plummeted in March. The outlook for 2Q remains dire for many industries and most firms will probably refrain from providing guidance for 2Q.
Which brings us back to the key issue: V, U... or L-shaped recovery. Here is how Goldman differentiates between the three possible outcomes:
The difference between a “V” and “U” in the stock market will depend on three developments:
One possibility is that business activity cannot normalize by late 2020 because the viral spread is worse than expected or has a hiatus and recurs in the fall. In addition, if short-term shutdowns lead to business defaults, closures, and permanent layoffs, the damage to corporate earnings growth could persist well after the virus is contained.
- whether the virus can be contained quickly, an answer difficult even for epidemiologists;
- whether companies, both large and small, have access to enough capital and liquidity to last the 90 to 180 days most investors expect (hope) will encompass the worst part of the crisis; and
- whether fiscal stimulus will act quickly enough to stabilize the economic and earnings outlooks.
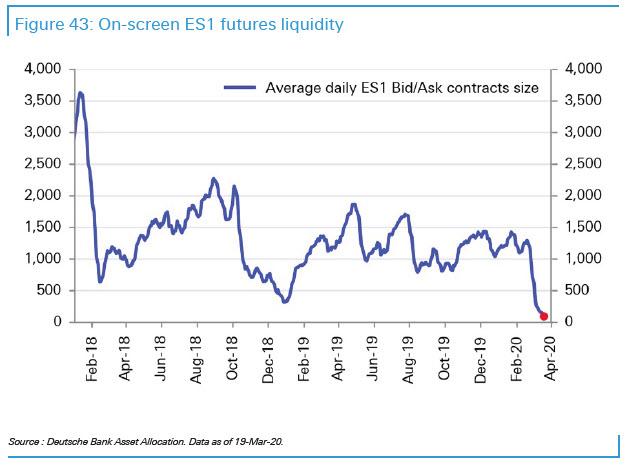
And while we wait, things get worse because below the market's increasingly shallow surface, which is manifesting itself in the record low liquidity we noted earlier...
... volatility continues to rage as a result of record low liquidity. And here is Goldman again:
Thin liquidity across asset markets has exacerbated price swings as investors try to assess the path of growth. Our equity illiquidity ratio, which measures the impact of trading volumes on share prices, shows the liquidity shock has now surpassed the December 2018 experience and is approaching 2008 levels. This trend is consistent with cycle-high bid-ask spreads and cycle-low top of book depth.
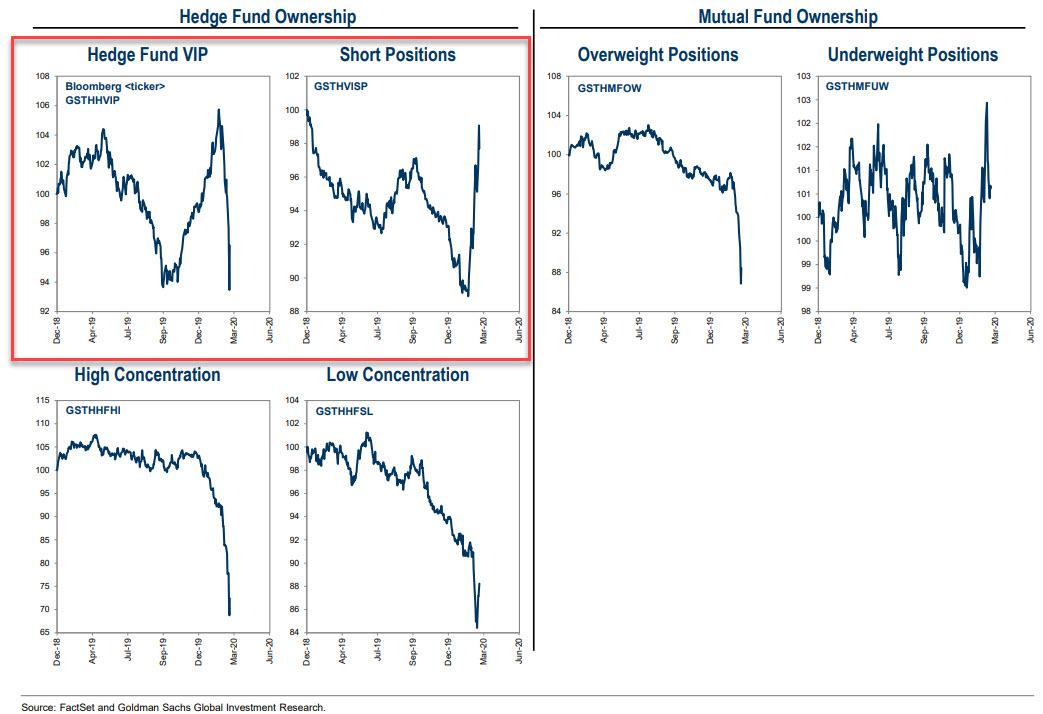
Indeed, one look at the recent performance of hedge funds shows how catastrophic the combination of tumbling stock prices coupled with illiquidity has been:
Illiquidity likely contributed to the sharp underperformance of popular hedge fund and mutual fund stocks this week as investors reduced risk. We have previously highlighted that investor positioning remained unusually elevated relative to levels at the bottom of other major S&P 500 corrections. This week, however, those positions declined. From Monday to Wednesday, our Hedge Fund VIP basket (GSTHHVIP) lagged our basket of large shorts (GSTHVISP) by 850 bp (-17% vs. -8%), more than any 3-day period in the nearly 20 years of the baskets’ history.
Mutual Fund Overweights (GSTHMFOW) also lagged Underweights (GSTHMFUW). However, both groups of popular stocks recovered extremely sharply, posting their best-ever days of outperformance on Thursday.
Finally, anyone hoping for a quick rebound will be disappointed: Goldman's Sentiment Indicator shows that equity positioning has plunged in recent weeks...
... "but additional selling is likely until positioning matches lows reached at the bottom of prior corrections."
In other words, even Goldman - which sees stocks storming back to 3,000 by year end (down from 3,200 a week ago) - warns that the S&P has a long way to go before it hits bottom.
Goldman's forecast just gets worse by the week, a 2000 pt on the...


Featured News
Featured News
The Watchlist
VMM
VIRIDIS MINING AND MINERALS LIMITED
Rafael Moreno, CEO
Rafael Moreno
CEO
SPONSORED BY The Market Online