Gold Prices Ripe For Breakout? Election Polls Show Diverging Trend
By Dimitri Zabelin of DailyFx
Wednesday, September 16, 2020 5:35 AM EDT
49 Days until the US presidential election
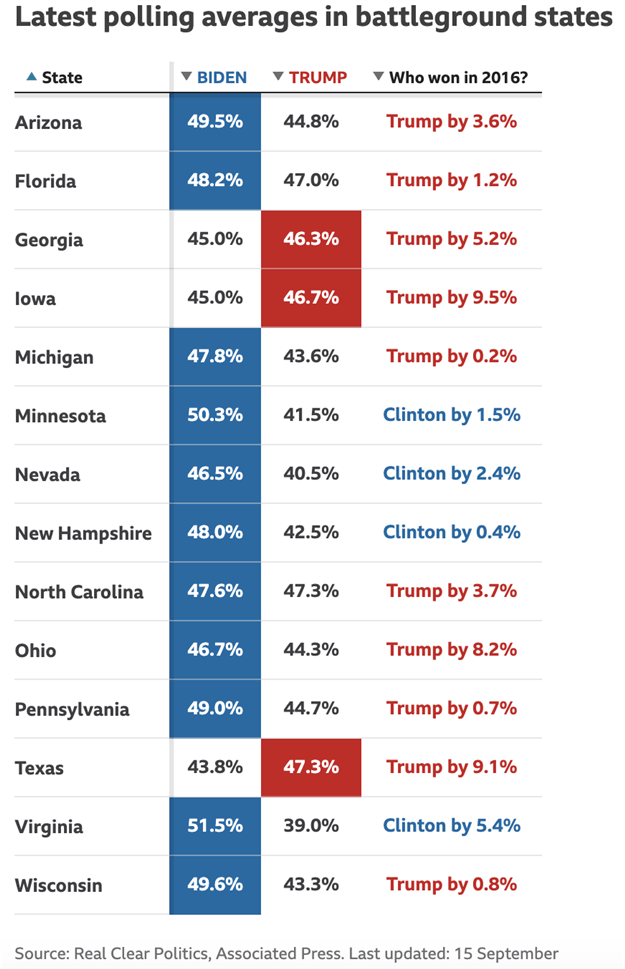
The latest polls show former Vice President and Democratic nominee Joe Biden in the lead not only in the general election but also in key swing states. While Donald Trump won these states in the 2016 election, the latest political data indicates a strong inclination for Mr. Biden. Having said that, betting averages are showing signs of convergence. But more on that later. 2020 US election polls
Source: BBC News As mentioned in my prior piece, key swing states like Florida continue to be the battleground of campaign capital allocation. Both Trump and Biden combined have spent close to $50 million in television ads alone in Florida. In 2008 and 2012, the state turned blue and Barack Obama was elected; in 2016 it turned red and Donald Trump entered the White House.
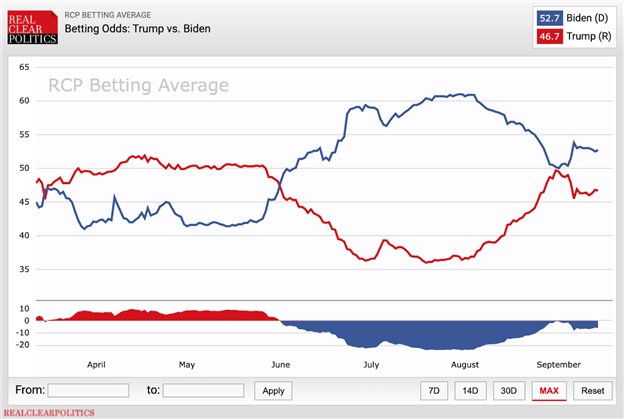
Looking ahead, how the margins fluctuate in the Biden-Trump spread ahead of the presidential debate on September 29 may create asymmetric risks of volatility. If the race becomes progressively tighter and the outlook becomes less clear, a directional change in the polls may catalyze a bout of volatility as traders reposition themselves to the new geopolitical landscape. 2020 Election betting averages
Source: RealClearPolitics
Returning to betting averages, the data briefly widened after converging to its narrowest point since the cross-over in June. However, betting averages indicate a slow but steady confluence despite polling data showing a widening Biden-Trump spread. How this trend plays out in the next 49 days may be critical. Gold price outlook
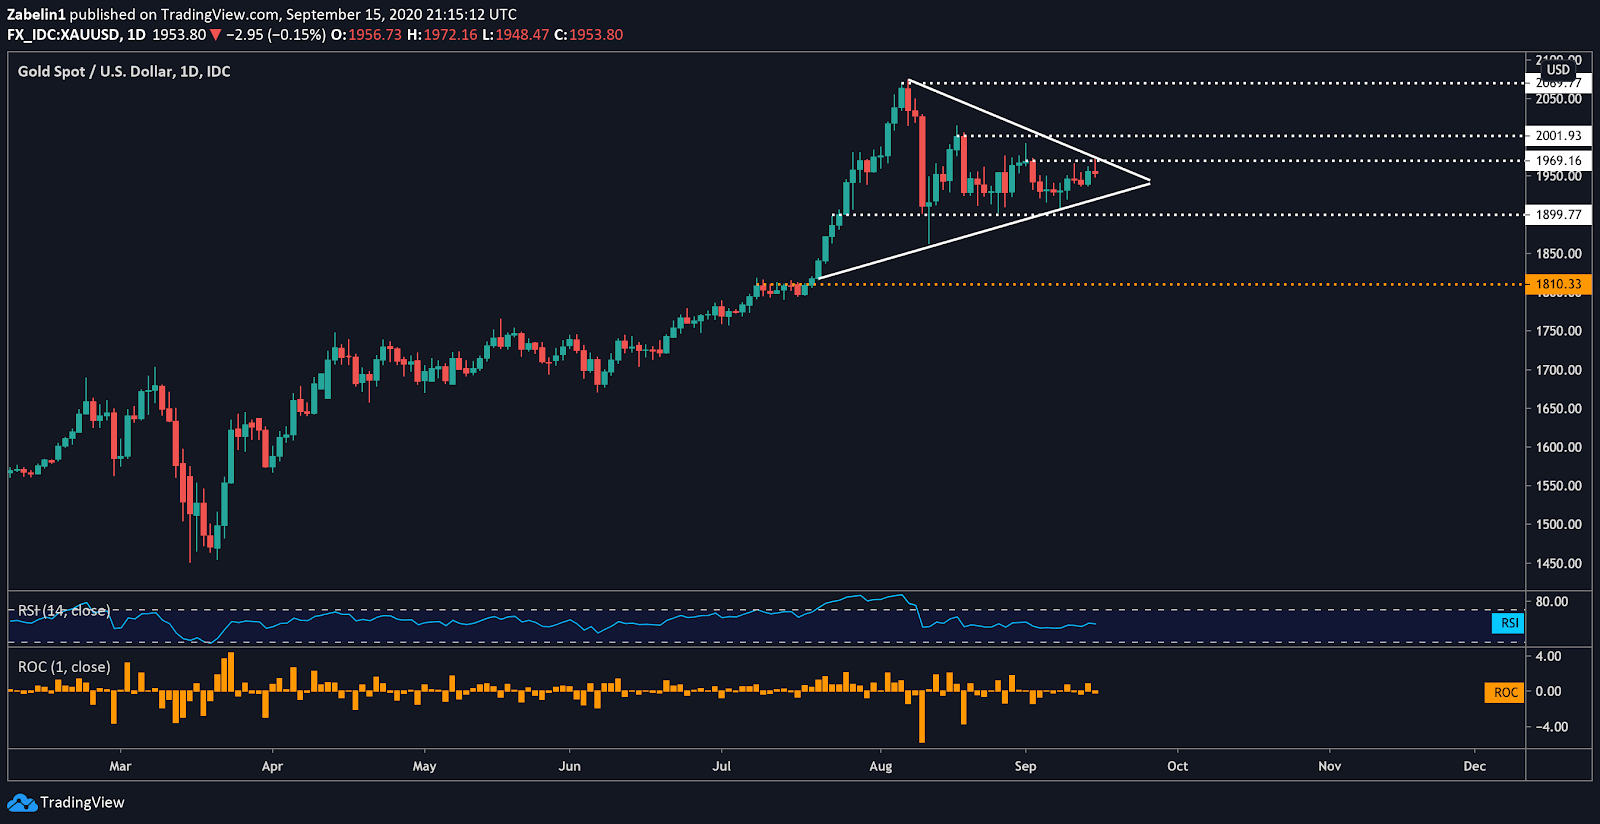
Gold prices appear to be nearing the end of a consolidative period following their aggressive rally in late-July and early-August. XAU/USD is forming what looks to be a continuation pattern known as a bullish Pennant. The formula for this technical design typically involves a rally followed by a digestive interim before the prior uptrend resumes. XAU/USD - Daily chart
(Click on image to enlarge) XAU/USD chart created using TradingView
However, chart formations do not always produce the embedded expectations associated with the technical pattern. I noted this phenomenon with my analysis of USD/MXN. Consequently, if gold prices break down, selling pressure may briefly encounter some friction at near-term support at 1899.77, but if that floor is broken the next major level may be at 1810.33.
On the other hand, if the compression zone between descending resistance and ascending support catalyzes a move higher, a bullish streak for gold may ensue. A key test of its durability will likely be the all-time swing-high at 2069.77. If cleared, bullish sentiment may continue to build with a confluence of narratives about its bright prospects, potentially pushing XAU/USD higher.