here is my "kiss" view of RED
1 year Daily:
1. Broken out of downtrend
2. Bollinger bands had contraced and share price broke out to the upside, and now hugging the top bollinger band
3. the 10 sma has now crossed the 200 sma (a golden cross!!)
4. the 10, 20 and 50 sma's have turned and are now pointing up
5. share price is sitting above the 100 sma
6. possible repeating range highlighted by the box drawn previously and now ??
3 year Weekly:
1. Support held and now Broken out of downtrend
2. share price has moved away from the botto bollinger and now heading towards the top bollinger
3. share price was supported by the 50 sma and now above the 10 sma
4. all sma's have turned and pointing up
5. possible repeating range highlighted by boxes??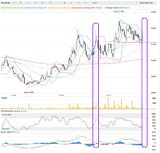
it's the weekend 8-10apr , page-35
-
- There are more pages in this discussion • 87 more messages in this thread...


You’re viewing a single post only. To view the entire thread just sign in or Join Now (FREE)