One thing of note on the SPX weekly is how far above the 13 and 21 week emas we have got ourselves. historically we don't usually roam that far. My inference is therefore more downside to bounce off the MAs.
Also I draw a line from the top following the trajectory of the down weeks so far (there is also a symmetry with the angle of ascent on the way up. Coincidentally, or not, my line more or less intersects with Voltaire's 155 day target and the 50% fib line. All very convenient.
We are of course likely to have a green week here and there on the way down so turn dates suggested by various posters may still be valid albeit shortlived.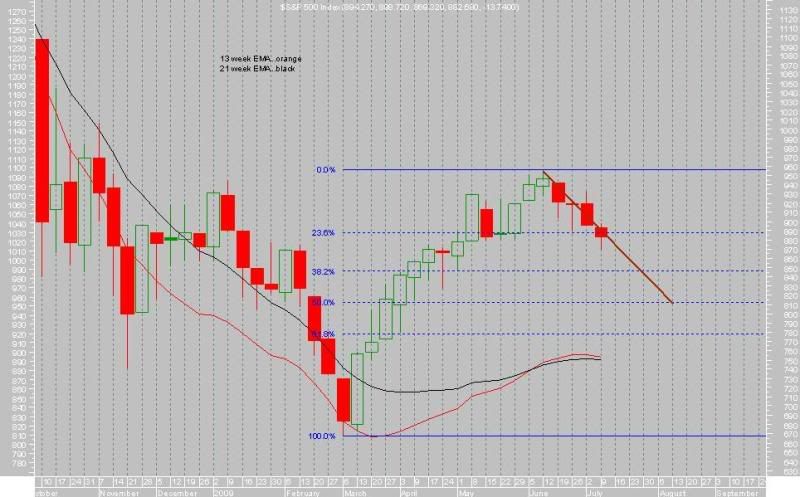
just reading the thread today, page-107


Add XJO (ASX) to my watchlist
 (20min delay) (20min delay)
|
|||||
|
Last
8,269.8 |
Change
57.600(0.70%) |
Mkt cap ! n/a | |||
| Open | High | Low |
| 8,212.2 | 8,285.7 | 8,212.2 |
| XJO (ASX) Chart |