A mild pullback so far, right to the 76.2% fib.
The overbought state has been worked off with stochastic and relative strength index now at the halfway mark down.
In this rally the stochastic has never bottomed, tending to rise back from the halfway mark.
MACD and stochastic have crossed down.
I'm not a great believer of ta using pivots, but for those who like them, here is the chart ---price fell 4 cents shy of Support 1 and bounced.
Price is supported by the blue 25-day sma, which cushioned falls since March. Volume is average, and accumulation/distribution is still on the accumulation side.
So,where to?
There's good support at $43.60ish, wich is also the 61.8% fib. And, by then, should hit the yellow 50-day sma.
Any pullback should not be overdone, so a good next soft landing spot.
Worst case scenario $42, the 50% fib, but I'd be very suprised to see that.
We're outside the short-term trendline, but inside the longer one from the March 2008 low.
Happy hunting fellow traders--- and lets not forget we are ABOVE $43!!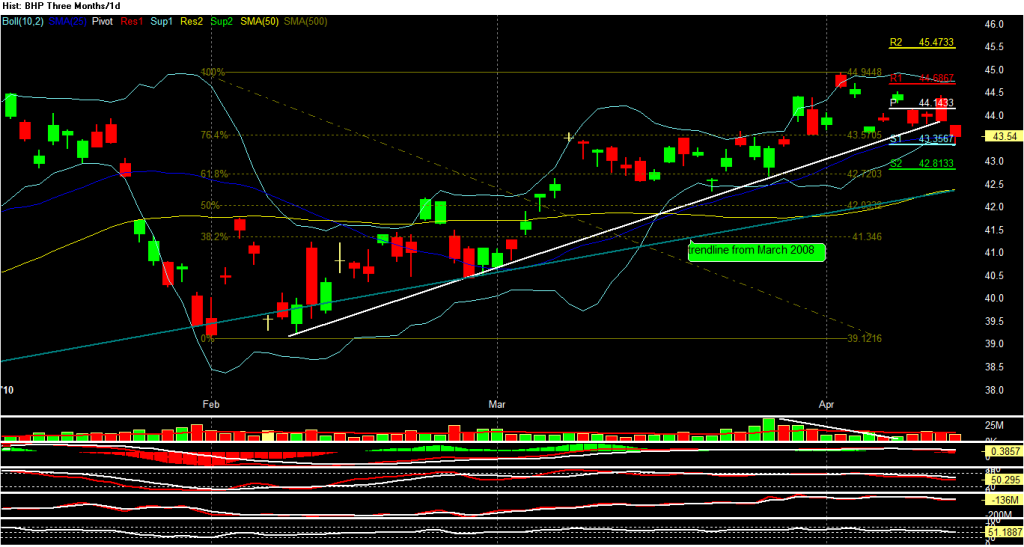
latest chart


Add BHP (ASX) to my watchlist
 (20min delay) (20min delay)
|
|||||
|
Last
$43.08 |
Change
-0.590(1.35%) |
Mkt cap ! $218.4B | |||
| Open | High | Low | Value | Volume |
| $43.05 | $43.21 | $42.75 | $381.3M | 8.870M |
Buyers (Bids)
| No. | Vol. | Price($) |
|---|---|---|
| 1 | 6113 | $43.06 |
Sellers (Offers)
| Price($) | Vol. | No. |
|---|---|---|
| $43.08 | 15792 | 1 |
View Market Depth
| Last trade - 16.10pm 16/07/2024 (20 minute delay) ? |
| BHP (ASX) Chart |