How does electric car adoption vary across US states?
Electric cars tend to be more popular in blue states. Why?
READ IN APP A few months ago, Iwrote aboutAmericans’ attitudes towards electric cars. Levels of scepticism are relatively high: less than half think that EVs were better for the climate than gasoline; and the majority are concerned about cost, driving range, and the impact on national manufacturing. These are understandable concerns.
There was also a wide partisan gap in attitudes. Republicans were more sceptical than Democrats.
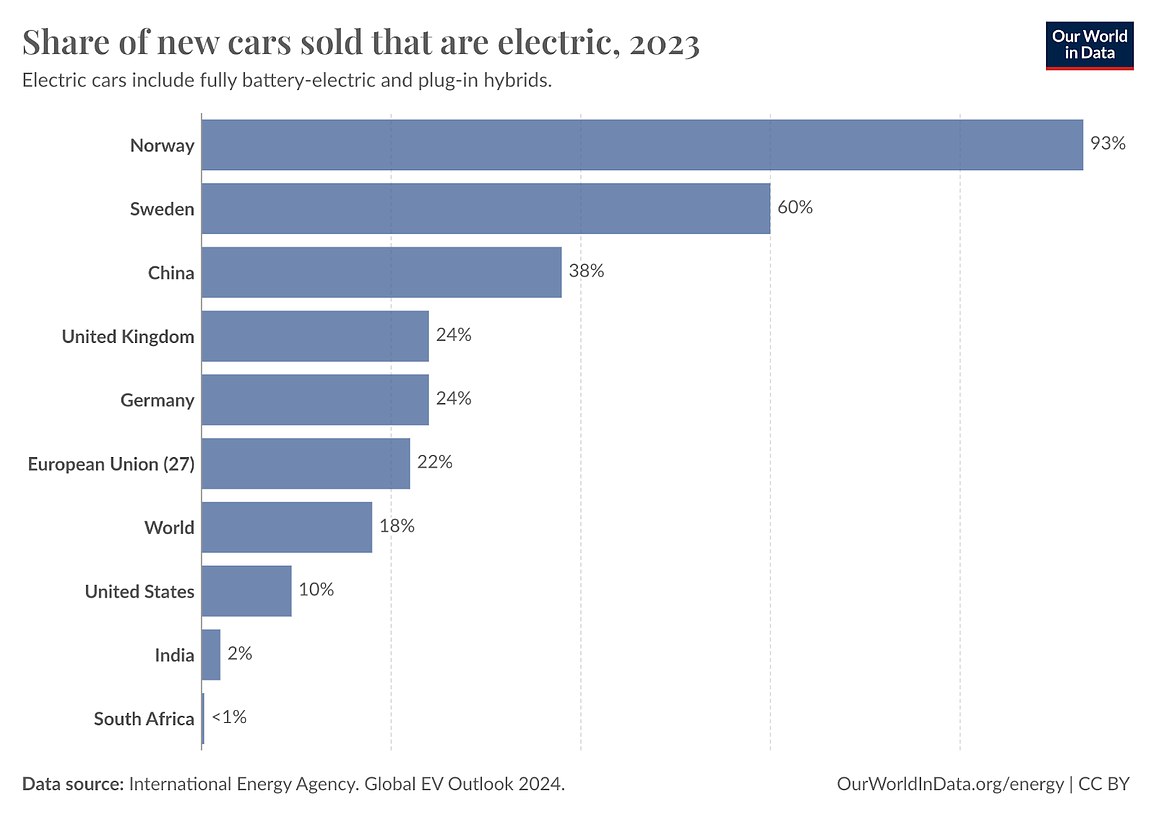
Lookingat international statistics, it’s clear to see that the US is proving to be a tougher market to crack for electric carmakers. Just 10% of new cars sold in 2023 were electric, compared to 22% in the EU, 38% in China, and the majority of cars in leading countries such as Sweden or Norway. See the chart below.
To be clear, electric car sales have still been rising in the US, just not with the same enthusiasm as in many other markets.
In this article, I wanted to look underneath the national data to understand patterns of EV adoption across the US. Which states are leading the way, and how large are the gaps across the country?
Electric car adoption state-by-state
Which states have the most electric cars on the road?
Here, I’ll look at data from the US Department of Energy’sAlternative Fuels Data Center. Its latest state-by-state data is from 2022, but I doubt the overall patterns will be dramatically different with a 2023 update.
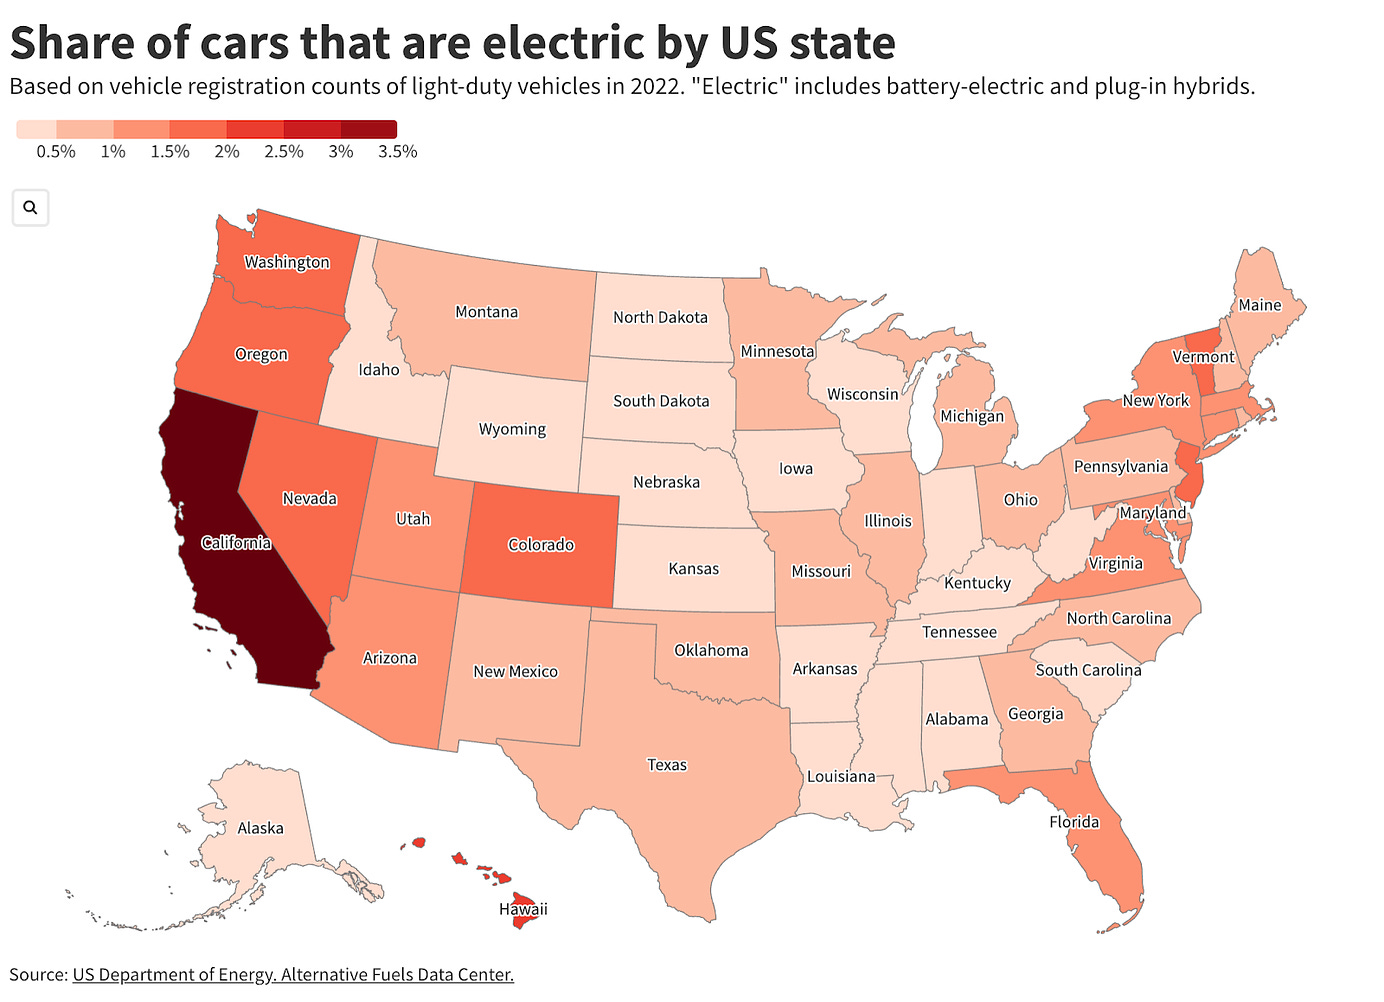
In the map below, you can see the share of carson the roadthat are electric. Don’t confuse this with newsales, where EVs make up a larger share than this.
For context, this figure for the US as a whole was 1.2% in 2022. Again, this is so low because it takes time for new cars to replace all of the existing cars on the road, with lifetimes of a decade or more.
Perhaps unsurprisingly, California has the highest rates, with a share of 3.5%. In fact, EVs are popular along most of the West coast (and parts of the East coast).
I’ve made aninteractive versionof this chart available so you can explore it in more detail.
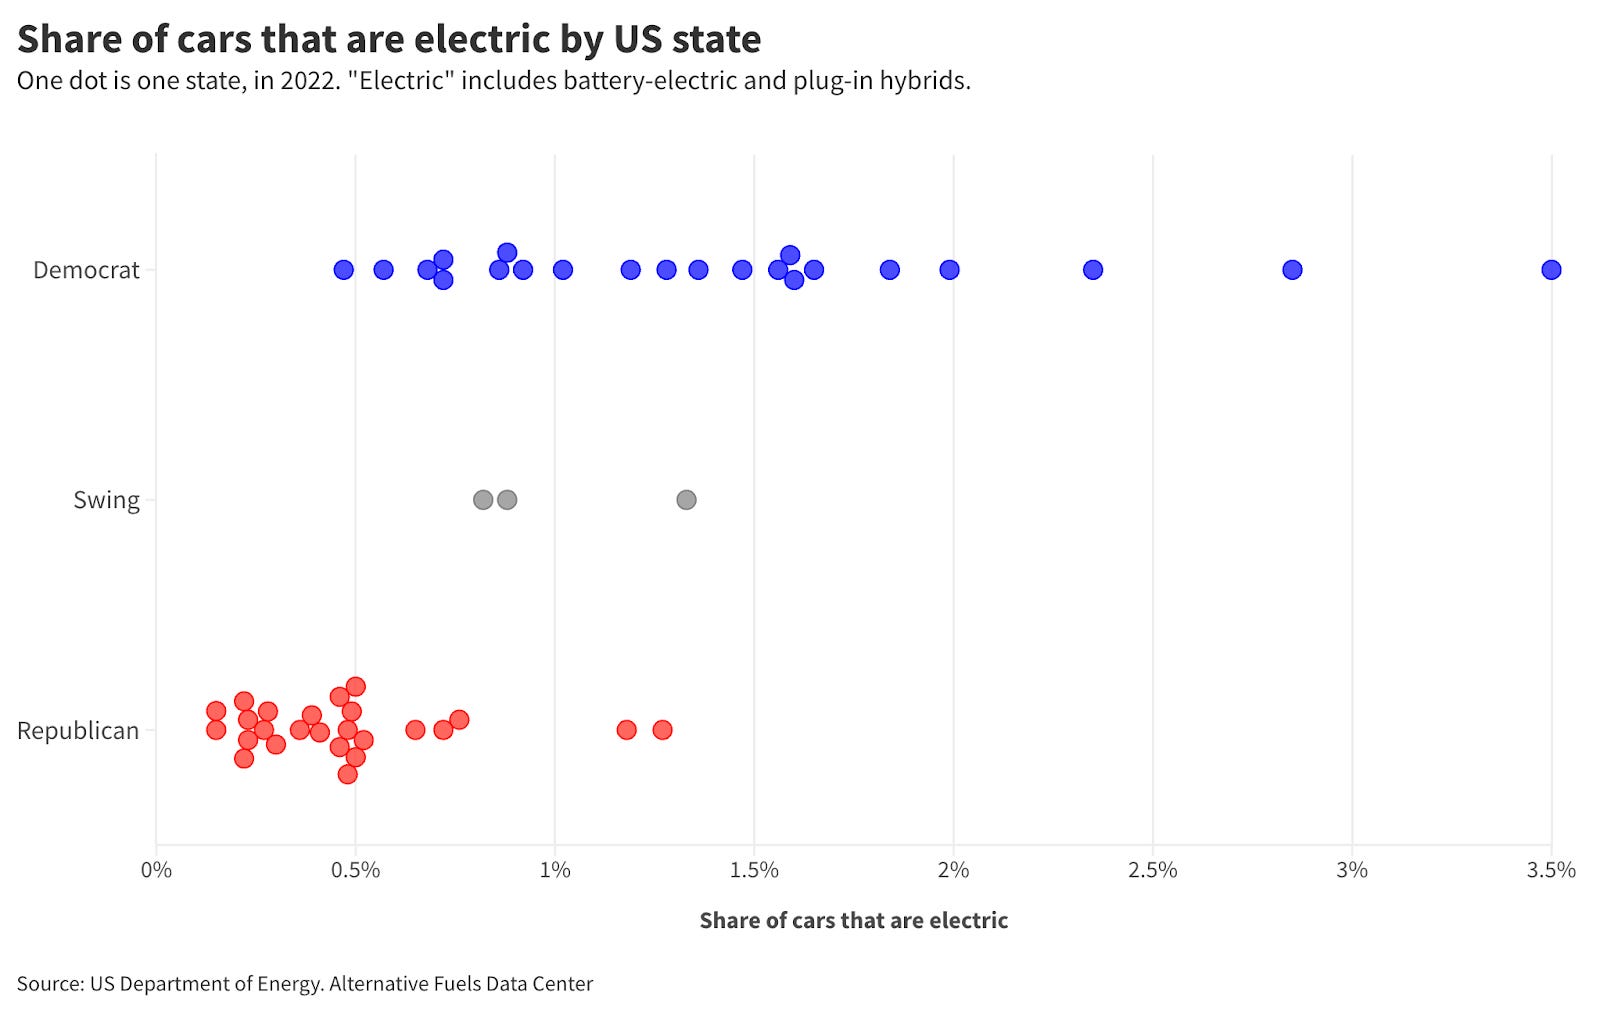
An obvious question that comes to mind is: are EVs more popular in blue (Democrat) states?
Below, I’ve shown the distribution across states, grouped by their political leaning. This is based on results from the last few elections: maybe there will be some swings later this year. One dot is one state.
All of the 10 leading states lean Democrat. Red states tend to cluster at much lower shares, with all but two (Utah and Florida) below the national average (1.2%).
Of course, being a blue state doesn’t guarantee EV popularity: there are many blue states that also have shares well below 1%.
Again, I’ve made aninteractive versionavailable so you can explore the distribution of the states for yourself.
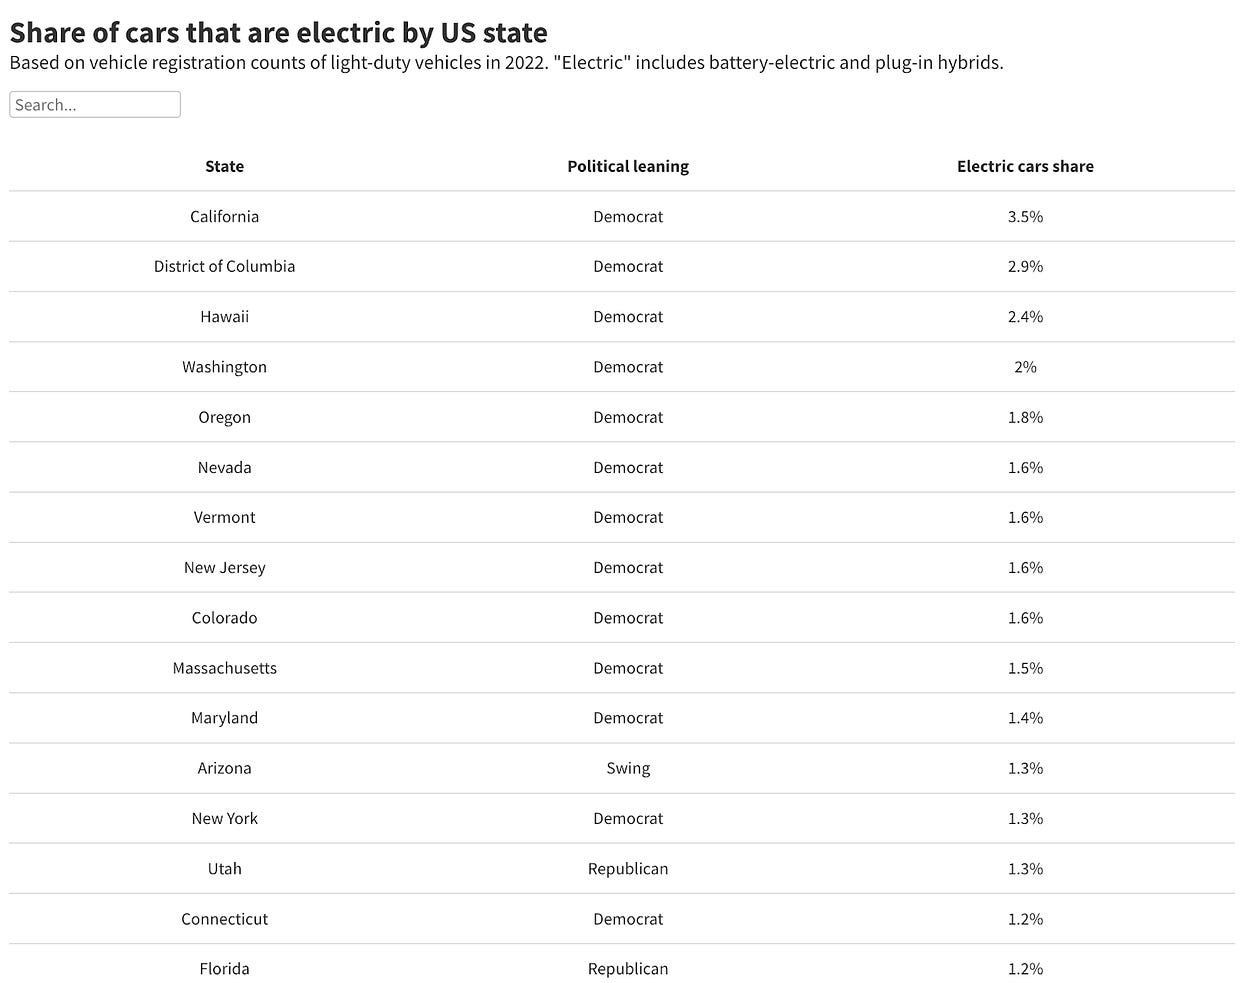
Finally, in case you need another option to explore the data, I’ve made aninteractive tablewhere you can rank or search for particular states.
Electric cars are more popular in richer states
What explains the differences across US states?
One obvious explanation is just differences in attitudes to electric cars. That might be the takeaway that you’d get from the survey data I looked at previously. Republicans are more sceptical about the benefits (environmental or economic), so red states have much lower rates of adoption.
That probably explains some of the difference. But maybe not all of it. Affordability and charging infrastructure are the biggest concerns for drivers, so I expect that also plays some role.
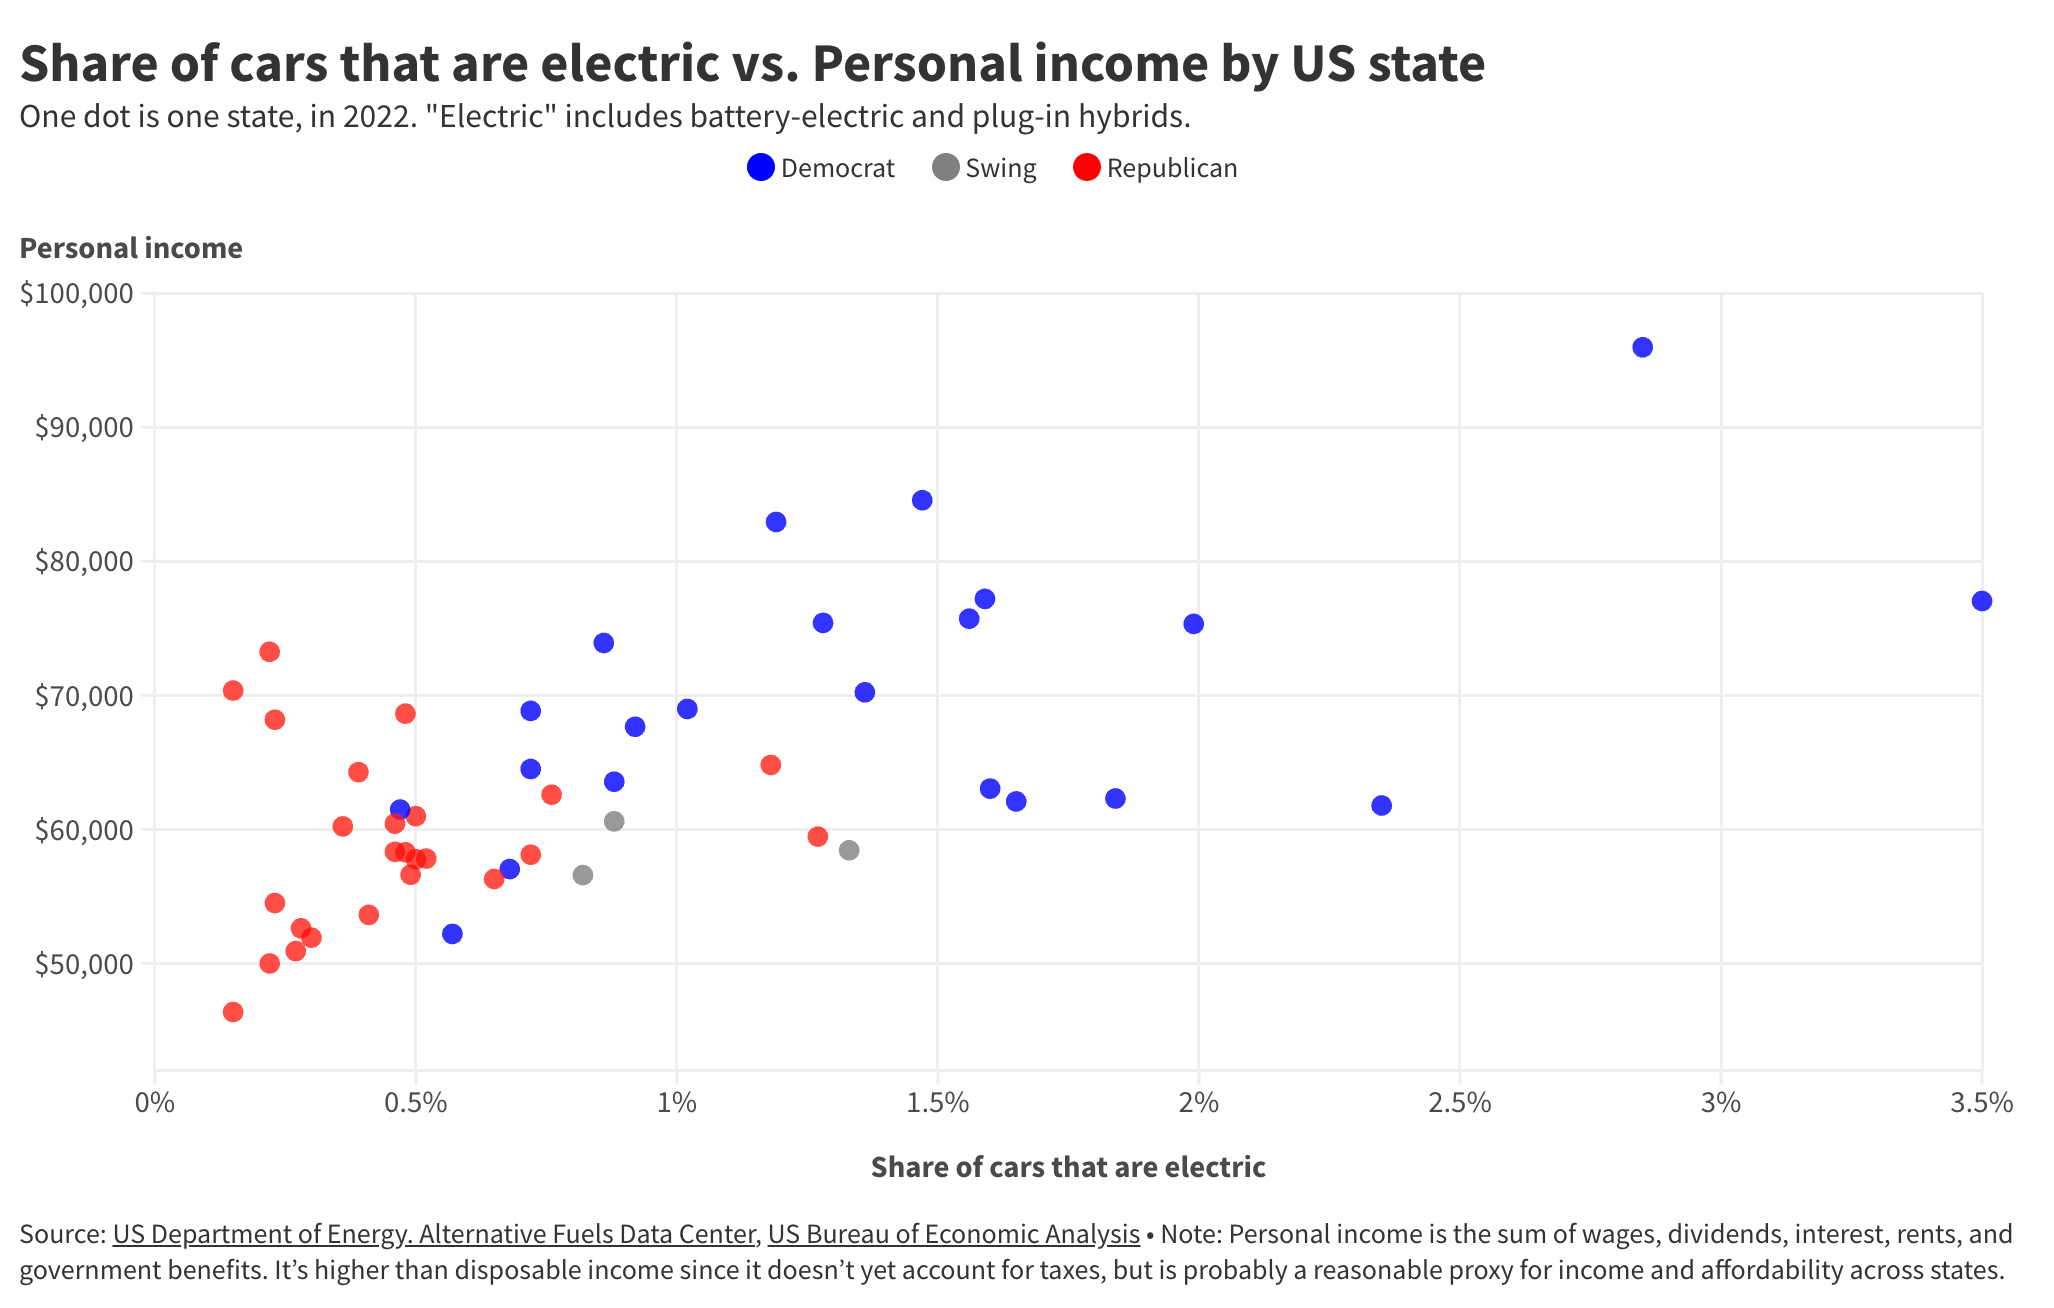
In the chart below, I’ve plotted EV adoption rates against the average personal income for each state. This economic data comes from theUS Bureau of Economic Analysis. Personal income is the sum of wages, dividends, interest, rents, and government benefits. It’s higher thandisposableincome since it doesn’t yet account for taxes, but is probably a reasonable proxy for income and affordability across states.
There is an imperfect but positive correlation. The strong outlier on the far right — which has more electric cars than you’d expect based on income — is California, where governments have provided bigger support for EVs. If you were to remove it, the positive relationship on the chart would be even more obvious.
Electric cars tend to be more popular in richer states.
It’s not that obvious whether there is any causal link here. Certainly, there is a rational explanation for why thiscouldbe the case. While the upfront cost of electric cars is falling pretty rapidly — and in some cases is now competing with petrol ones — it has still been the biggest barrier over the last decade. Electric cars have been unaffordable for most households, and it’s mostly the elites or the passionate early adopters who have been buying them.
It would totally make sense, then, that richer states would have more electric cars. This would also be good news for future trends. If it’sonlyabout economics, then electric cars will really take off in the more stubborn states too, so long as the costs continue to fall.
This simple explanation is complicated by the fact that Republican states tend to have lower incomes per person. So, do poorer states just have fewer EVs because they’ve been too expensive, or do they have fewer because they tend to be more right-leaning and there is strong cultural and political opposition to them?
This positive relationship still seems to hold true — but less strongly and with more outliers — when lookingonlyat Democrat or Republican states. Perhaps, then, it’s some combination of the two?
Electric cars get more popular with income (or affordability) but with different slopes depending on the underlying sentiment towards them.
How does charger availability vary across states?
The other big factor that affects driver confidence is the charging infrastructure. No one buys an electric car if there is nowhere to charge it.
Now, a word of caution. I get asked questions like, “Does X have enough chargers?” quite a lot. The assumption is that there is a simple definition of “enough” and that this number is the same across every country or city in the world.
It’s actually pretty hard to assess and compare different settings without really considering the local context. American suburbs, where everyone lives in a detached house with a big driveaway that they can charge their car in, would need far fewer public chargers than dense cities where everyone lives in a flat and almost no one has a garage. Areas where employees can charge their cars at work will need fewer than areas without these sorts of companies.
So, there is no universal number that will tell us whether a country, a state, or a city has “enough”.
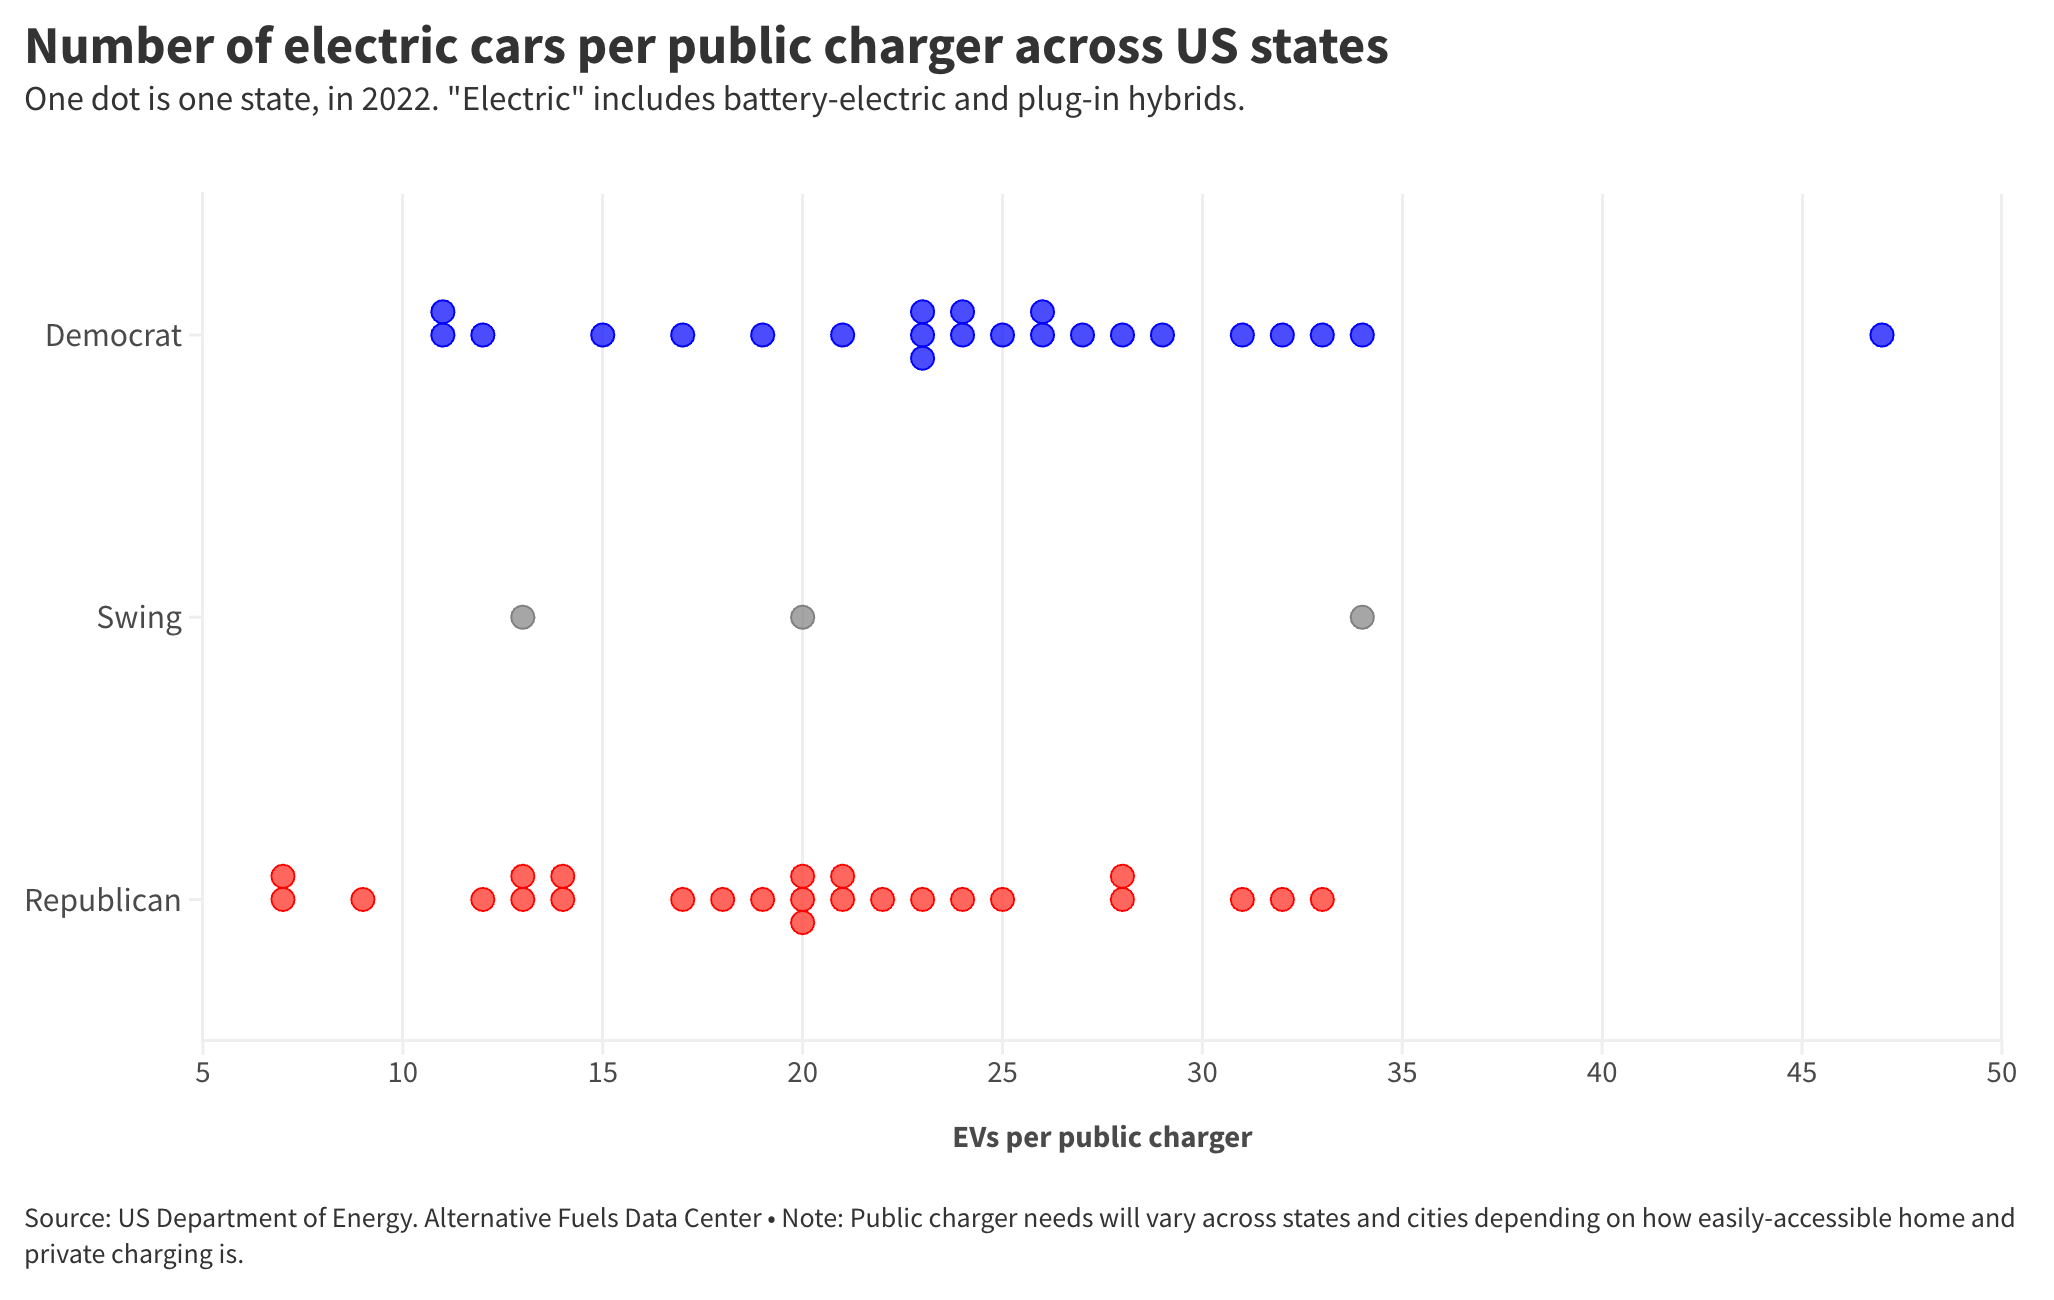
With that disclaimer in mind, let’s look at the ratio of electric cars and public chargers in each state. This is given as the number of electric cars per public charging port, based on figures from theUS Department of Energyat the end of 2022. These ratios might have changed in the last year or so, depending on how charging infrastructure has scaled with new EV sales.
Lower numbers are generally better: you’d rather have 10 cars sharing a charger than 100.
There’s not a massive difference between the “average” blue and red state. Most are clustering in the 15 to 30 EVs per charger range. The distributions strongly overlap. Some of the states with the fewest electric cars per charger are Republican. California, where EVs are most popular has one of the higher ratios, at 34 cars per charger.
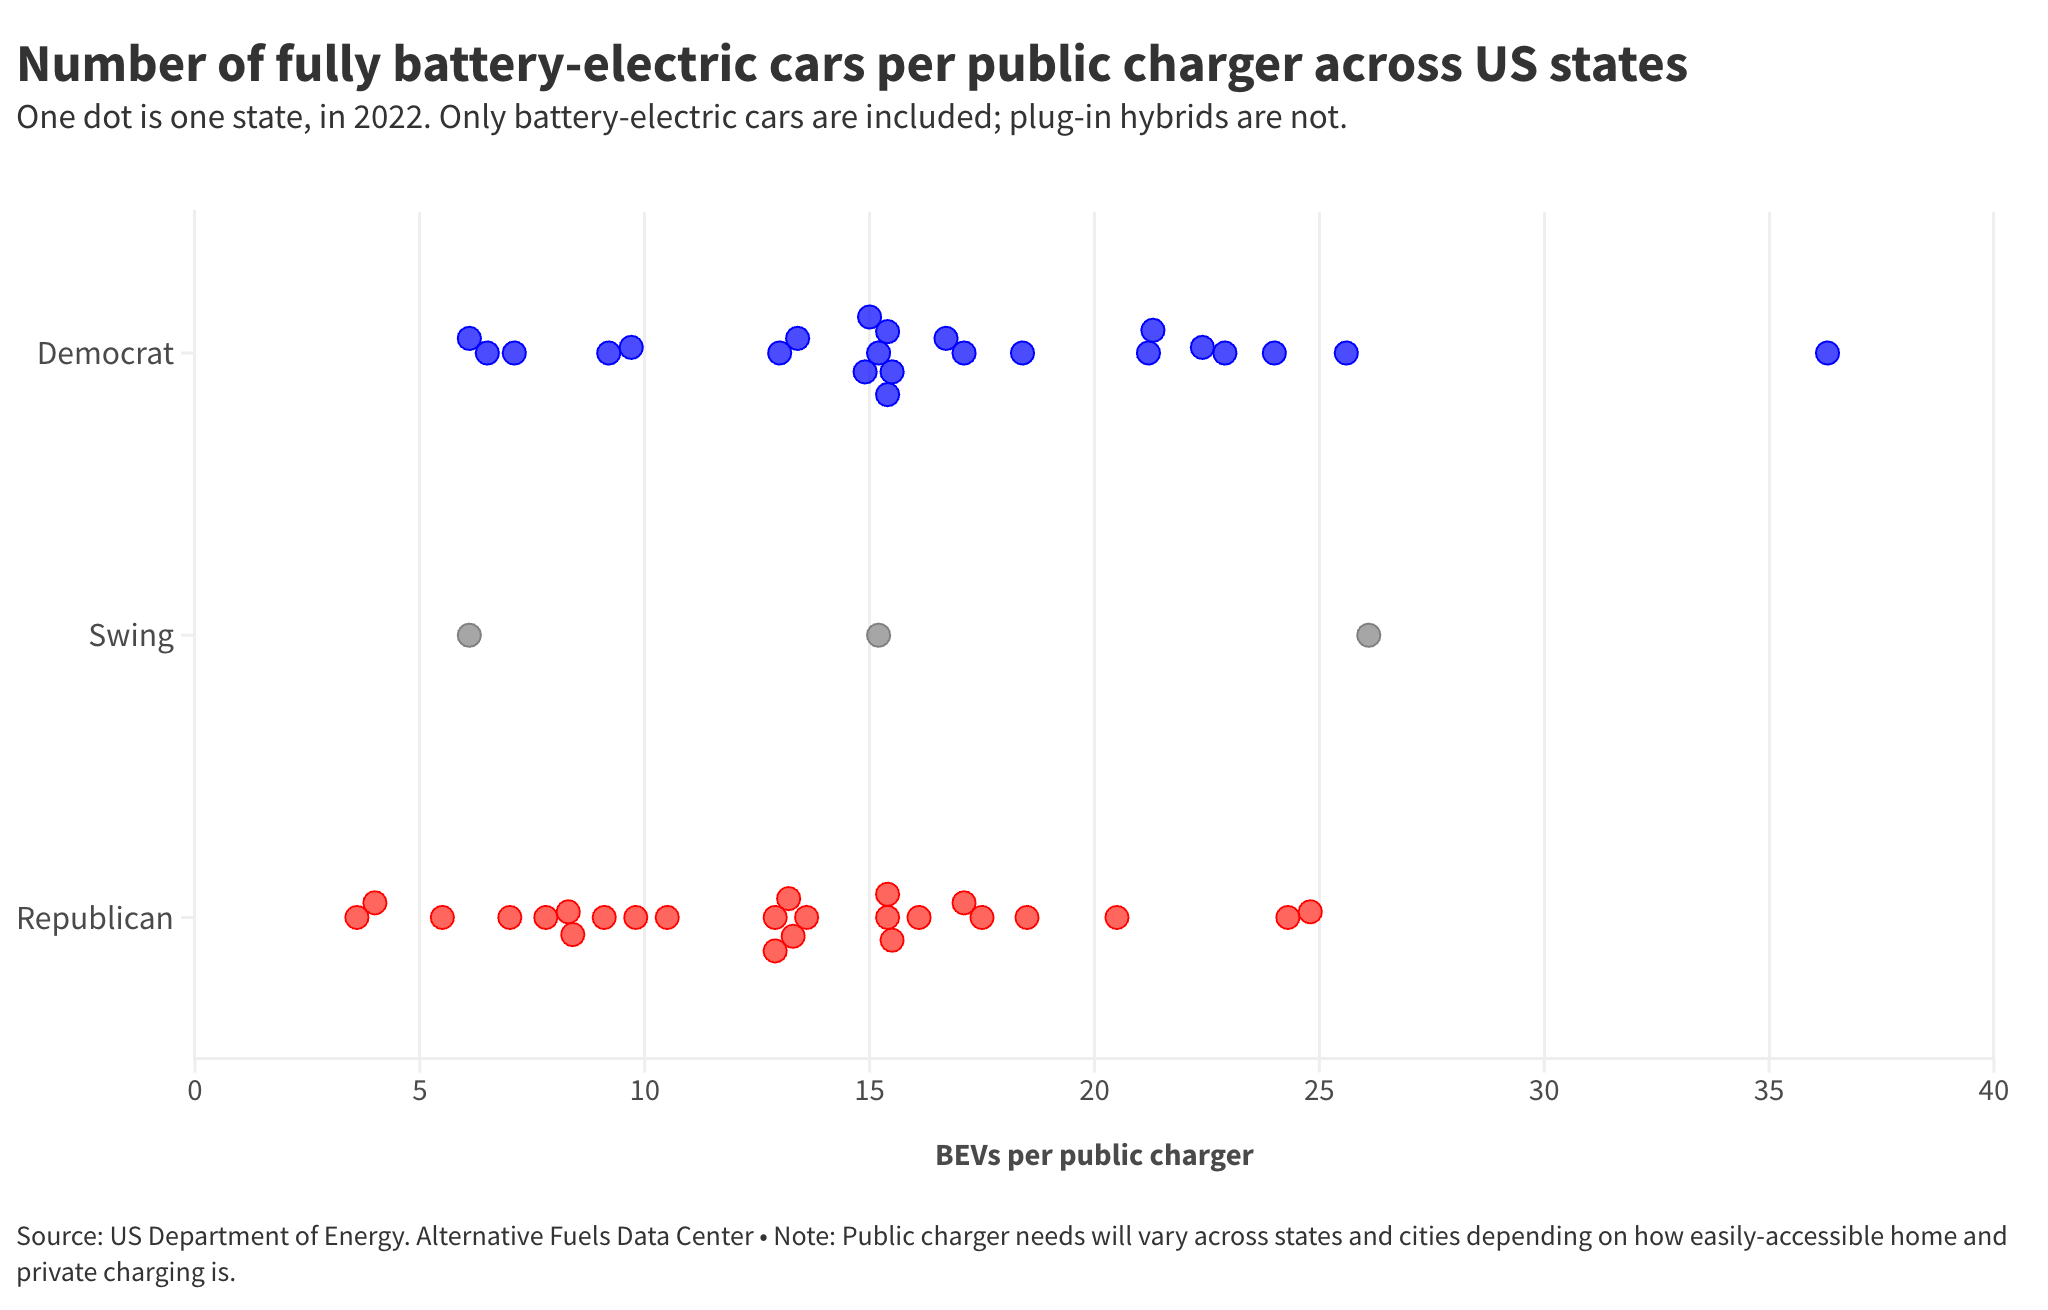
The chart above includes both fully-battery electric and plug-in hybrid cars. I’ve also plotted these ratios with only fully-battery electric included. The conclusions don’t change much, but obviously, every state’s ratio improves (goes down) slightly. California’s ratio, for example, falls from 34 down to 24.
If you plot the cars-to-charger ratio against the adoption of EVs (see below), the relationship is not particularly clear. Or, at least, not the defining factor for states with the highest popularity. Public charger availability is not much better than in some states with low adoption rates.
This weak relationship is particularly true for Democrat states. If we look only at Red states, there is some positive relationship: more chargers correlate with a more popular EV market.
There’s no question that charger availability is important for potential EV owners. But from a surface-level look at the data, I’m sceptical that this is the main factor holding back EV sales in many states. Cost and social attitudes seem like the biggest barriers to adoption.
How does electric car adoption vary across US states?Electric...


Add LTR (ASX) to my watchlist
 (20min delay) (20min delay)
|
|||||
|
Last
96.5¢ |
Change
0.035(3.76%) |
Mkt cap ! $2.340B | |||
| Open | High | Low | Value | Volume |
| 95.5¢ | 98.0¢ | 94.0¢ | $13.99M | 14.56M |
Buyers (Bids)
| No. | Vol. | Price($) |
|---|---|---|
| 6 | 245349 | 96.0¢ |
Sellers (Offers)
| Price($) | Vol. | No. |
|---|---|---|
| 97.0¢ | 330617 | 9 |
View Market Depth
| Last trade - 16.10pm 11/07/2024 (20 minute delay) ? |
| LTR (ASX) Chart |