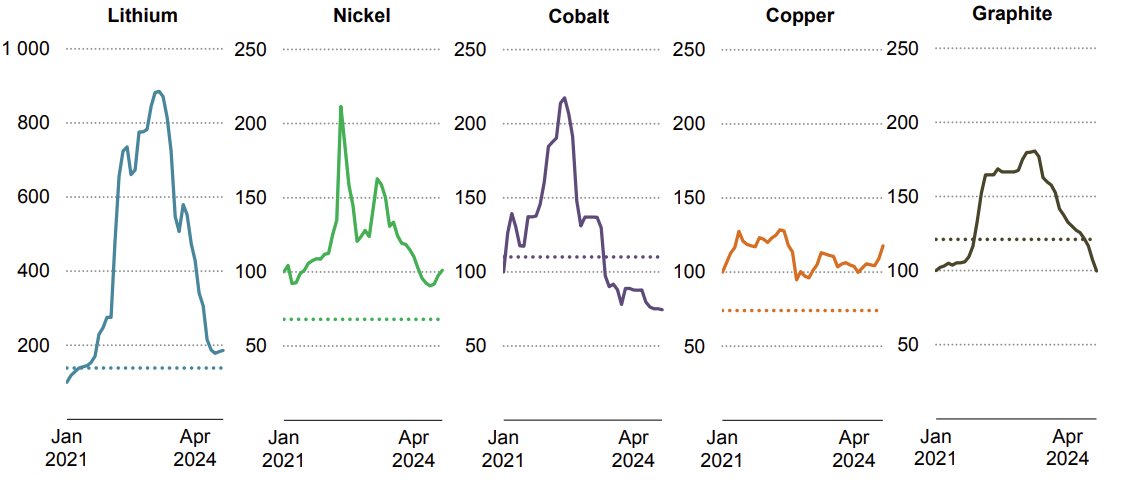
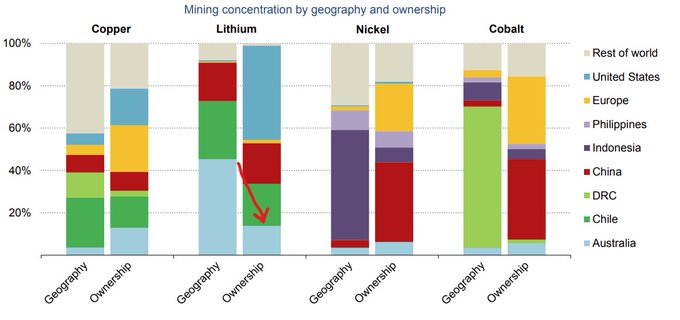
Haven't posted in a little while, so some more of my thoughts whilst i sip my morning coffee. You'll notice that as soon as China get the majority control over a particular commodity, the price flat lines.Cobalt, Nickel and Lithium are three perfect examples (price charts below).I saw a post on X this morning that said that the oversupply in lithium has come from production in the west rather than China. Whilst this is true geographically, its very important to look at this by country ownership, which is what the other chart below portrays. So whilst the majority of lithium mining comes from Australia, its important to look at the ownership of these assets. Greenbushes for example is essentially totally controlled by the Chinese, despite only having 26% ownership. I do think that lithium is different to both nickel and cobalt and should be compared to iron ore.Lithium demand is growing at ~25% a year and nickel and cobalt sit at ~3/4%. The market size for cobalt is around 220kt and for nickel its around ~3Mt. The size of the lithium market is expected to hit ~4.3Mt LCE by 2030, soon to surpass nickel. As I've mentioned before in several posts, i see many similarities to iron ore. Lithium is going through what iron ore went through from 2003-2014. The iron ore demand essentially grew from ~1200Mt in 2003 to ~2700Mt in 2014, fueled by China’s massive growth. During this period, China desperately tried to gain control over the iron ore price and reduce it’s dependence on Australia. Looking at just how healthy the margins have been for the likes of BHP, RIO, FMG, it’s safe to say that this mission wasn’t achieved.1. Attempt to process internal low grade iron ore.China poured billions into their own low grade iron ore (lepidolite analogy anyone?) in order to help gain control over the price of iron ore. It worked for a while, however, they underestimated the scale at which these mines operate and the growth at which they were consuming. It effectively failed and China remained dependent on paying fair prices for overseas iron ore. Even though Chinese domestic growth was expanding rapidly, it still couldn’t match the rate at which steel production was taking place. This infrastructure growth happened exponentially. Every analyst predicted it would be linearly, just as they are doing now with lithium consumption. Its exponential.2. Stakes in companiesA well known case is in 2008, Chinalcos failed investment in RIO which was prevented by the Australian government at the time. They wanted to gain control over the iron ore price. If this deal had have gone through, the iron ore price would have been decimated. Tianqi’s involvement with Greenbushes. Why is Tianqi struggling to make Kwinana work? Shouldn’t feeding US$330 per tonne of SC6 into it print cash? What are we missing here. I mean they are successfully running several other downsteaming plants throughout China. Overall plan to gain more control of Greensbushes?3. Development of Overseas minesMany examples to choose from, but a modern example is Simandou iron ore deposit. Consider this the Manono of iron ore. Great deposit, has been known about for decades, but the OPEX will be high. Manono has also been known about for many decades and has a series of shallow mines across it already.---Most iron ore companies are making 4~5 x margins at the current iron ore price. That’s the equivalent to a spodumene price of ~US$2000-2500. Lets look at some quick numbers to compare. (I’ve converted LCE to SC6 equivalent for clarity). Also, just something to keep in mind, iron ore is generally mined at ~60% grade whilst lithium is mined at ~1.2%. One tonne of LCE is 40.4% li2O.2023 SC6 eq demand ~6.79 Mt 2030 SC6 eq Demand ~32.3 Mt (adopting 4.3Mt LCE)2003 iron ore demand ~ 1200Mt2014 iron ore demand ~ 2700MtAverage yearly output of an Iron ore mine – 35MtpaAverage yearly output of a spodumene mine – 300kt of SC6 So the lithium market is smaller by tonnage, but it's actually growing faster than what iron ore did during its boom. Also, if you look at it in relative terms, a different picture is painted. I think the yearly output per mine/total demand is an interesting metric as it provide the number of mines required. Lithium - 32.3Mt/300kt = 108Iron ore - 2700Mt/35Mt = 77Lithium will require more mines to meet demand because individual lithium mines are much smaller relative to market size. A very important metric. They are also much harder to find, making lithium supply expansion harder to achieve.Lithium will need ~108 mines by 2030, almost double the number of mines iron ore needed in 2014 (~77 mines).So whilst its all doom and gloom now, its important to look at the bigger picture. Good quality assets need to be protected. Its a shame to see good quality assets (such as KV) being chewed through at a loss. These assets are finite and very rare, they have a mine life. Its embarrassing that the Australian government is allowing spodumene to be exported at a loss per tonne. Just goes to show they don't understand finite nature of these deposits. Very short term thinking.As I've said before, the Chinese attempted to use low quality internal iron ore, buy stakes in overseas mines (RIO), etc. in order to gain control of the price. This turned out to be unsustainable and the price of Iron ore increased overtime. We are seeing this again with lithium. Lepidolite isn't a solution and neither is low quality assets in unstable, landlocked jurisdictions. Thanks for reading!


 (20min delay)