Hi cuzo, yes the BHP chart is interesting. BHP has been in an uptrend for several years. As well as a multiple head and shoulders it has also formed a double top. the last peak looks like a failed h&s pattern and the right shoulder of the old pattern becomes the left shoulder of the new. even though the SP was coming down immediately into the current pattern the long term trend was still up so i would still consider the H&S is at the end of a long uptrend.
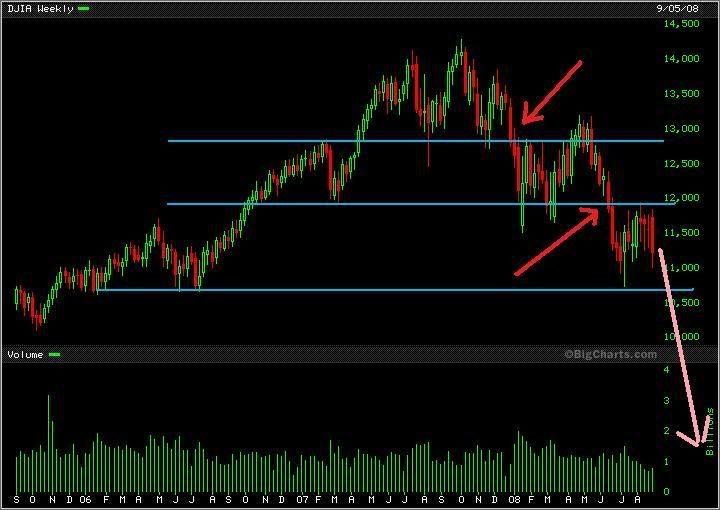
As for your other concern about the inner and outer H&S a good recent example is the DOW. as can be seen on the chart below the entire bear market has been the result of 2 H&S breakdowns with a possible 3rd on the way. The big big slides in jan and post May are the breakdown points.
I see BHP with a similar pattern now.The secong H&S haas just started its break....
- Forums
- ASX - By Stock
- BHP
- long term target is 24
long term target is 24, page-44
-
- There are more pages in this discussion • 24 more messages in this thread...
You’re viewing a single post only. To view the entire thread just sign in or Join Now (FREE)
Featured News
Add BHP (ASX) to my watchlist
 (20min delay) (20min delay)
|
|||||
|
Last
$42.78 |
Change
0.140(0.33%) |
Mkt cap ! $217.0B | |||
| Open | High | Low | Value | Volume |
| $42.25 | $42.97 | $42.14 | $223.0M | 5.233M |
Buyers (Bids)
| No. | Vol. | Price($) |
|---|---|---|
| 4 | 10160 | $42.77 |
Sellers (Offers)
| Price($) | Vol. | No. |
|---|---|---|
| $42.79 | 5000 | 1 |
View Market Depth
| No. | Vol. | Price($) |
|---|---|---|
| 1 | 600 | 42.770 |
| 2 | 149 | 42.750 |
| 1 | 5 | 42.720 |
| 2 | 1023 | 42.700 |
| 1 | 1 | 42.510 |
| Price($) | Vol. | No. |
|---|---|---|
| 42.850 | 5000 | 1 |
| 42.900 | 4300 | 3 |
| 42.920 | 460 | 1 |
| 42.950 | 500 | 1 |
| 42.960 | 200 | 1 |
| Last trade - 16.10pm 01/11/2024 (20 minute delay) ? |
Featured News
| BHP (ASX) Chart |


