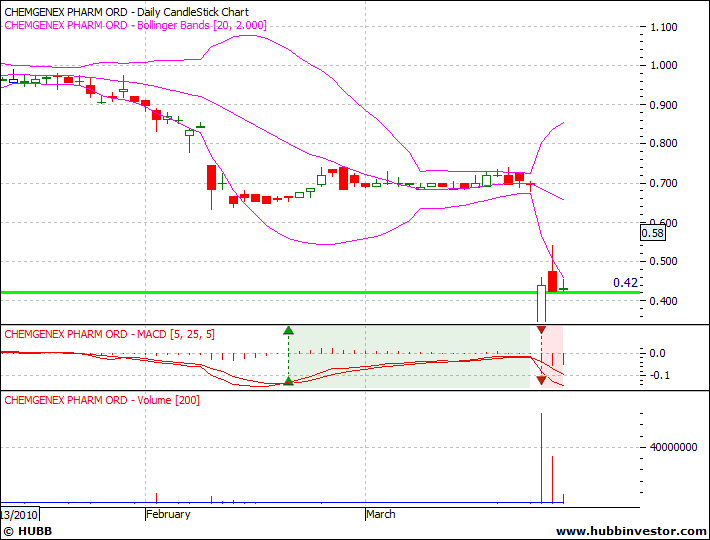
Yesterday's VWAP was some 48 cents but it closed at 42 cents which suggested that the closing price was not in keeping with the bulk of where the trading activity took place.
Today it stroked the 42c mark again and improved at close by a cent:
The low of 42c today and yesterday indicates a tweezer bottom candlestick. Some might call it a bullish tweezer bottom candlestick:
This pattern signals a trend... How to identify... Similar pattern(s)... Reversal
- 1st day consists of a long body candle.
- 2nd day consists of a short body candle that has a low equal to the prior day's low.
- The color of each candle body is not considered in the matching of this pattern.
Psychology...
The price action has trended downward then 2 consecutive days of equal lows signal support. This could signal a short term bottom is forming.
From http://www.hotcandlestick.com/directory/Bullish Tweezer Bottom.htm
Today's candle together with yesterday's candle is almost a a bullish harami. I say almost because there was no pre-existing downtrend before the last announcement by the company.
This pattern signals a trend... How to identify... Similar pattern(s)... Reversal
- The 1st day is a long black day.
- The 2nd day is a short day whose body is engulfed by the 1st day's body.
Psychology...
A long 1st day with high volume in the existing downtrend brings complacency to the bears. The next day trades in a small range within the previous day's real body. Light volume on the 2nd day should give rise to concern by the bears of an impending change of trend. Look for higher prices over the coming days, especially if the next day provides confirmation of a trend change by closing higher.
From http://www.hotcandlestick.com/directory/Bullish Harami.htm
The candles are still completely outside the bollinger bands which indicates the stock is oversold.
So on the bull side, we have a stock which is oversold and candlesticks indicating a possible reversal. 42 cents should be support albeit weak support at this stage.
On the bearish side, the tweezer bottom and bullish harami are not particularly strong signals. Also, oscillators such as RSI and stochastics can continue to be oversold when there is a trending market so just because it is oversold does not mean that it should bounce back up. Also the Bollinger bands will keep expanding and engulf the chart pattern so you can't rely on bollies either solely to predict price movements.
I think there will be a tendency for the stock to try and fill that gap. Unlike other companies whose share price has recently crashed, the action on the day of the announcement suggested that this was not a breakaway gap, and that the market would try and fill it. And it was filling the gap until an analyst downgrade came much after the horse had bolted (RBS previous target price $1.51 moved to 45c. No I am not kidding, they just cut the target price by more than 2/3rds. No doubt after undertaking complex algorithmic calculations with a large hadron collider, NASA's supercomputer and a dart board).
Caution though that I have been wrong many times before.
Yesterday's VWAP was some 48 cents but it closed at 42 cents...
Add to My Watchlist
What is My Watchlist?


