If you are wondering what will happen to mining stocks when the stock market collapses, take a look at this…
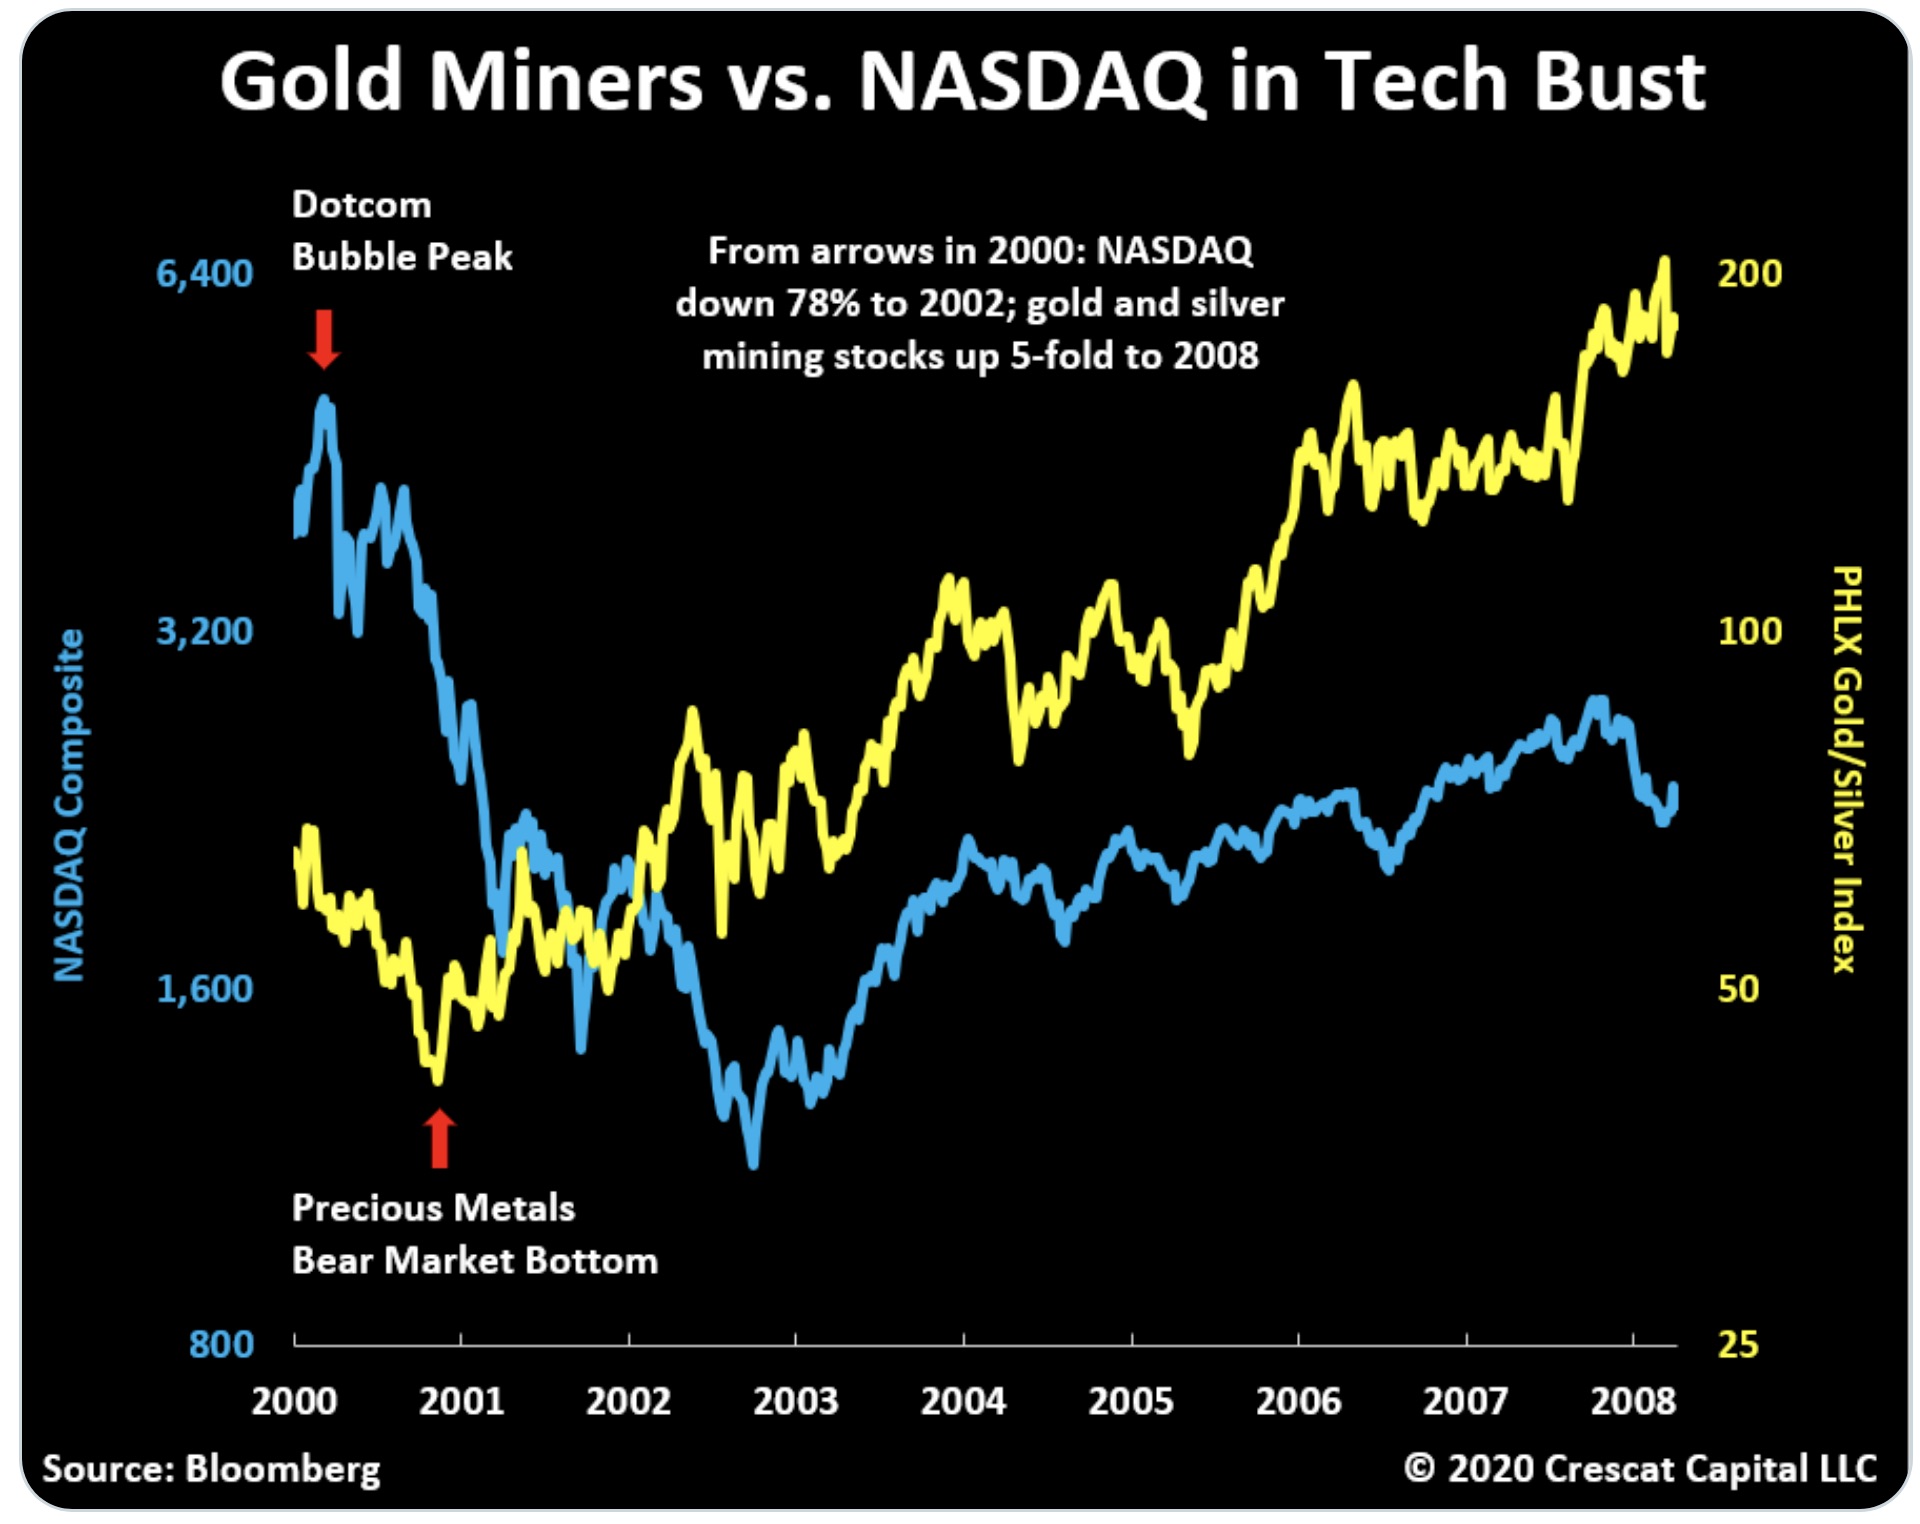
October 29 (King World News) – Kevin Smith, Global Macro Hedge Fund Manager: From 2000, NASDAQ declined 78% to 2002 while gold stocks climbed 5x to 2008. Today, the tech sector is an even higher % of GDP than the dotcom peak while mining stocks offer incredible value + growth prospects. (See chart below).
Mining Stocks Soared During Dotcom Tech Bust!
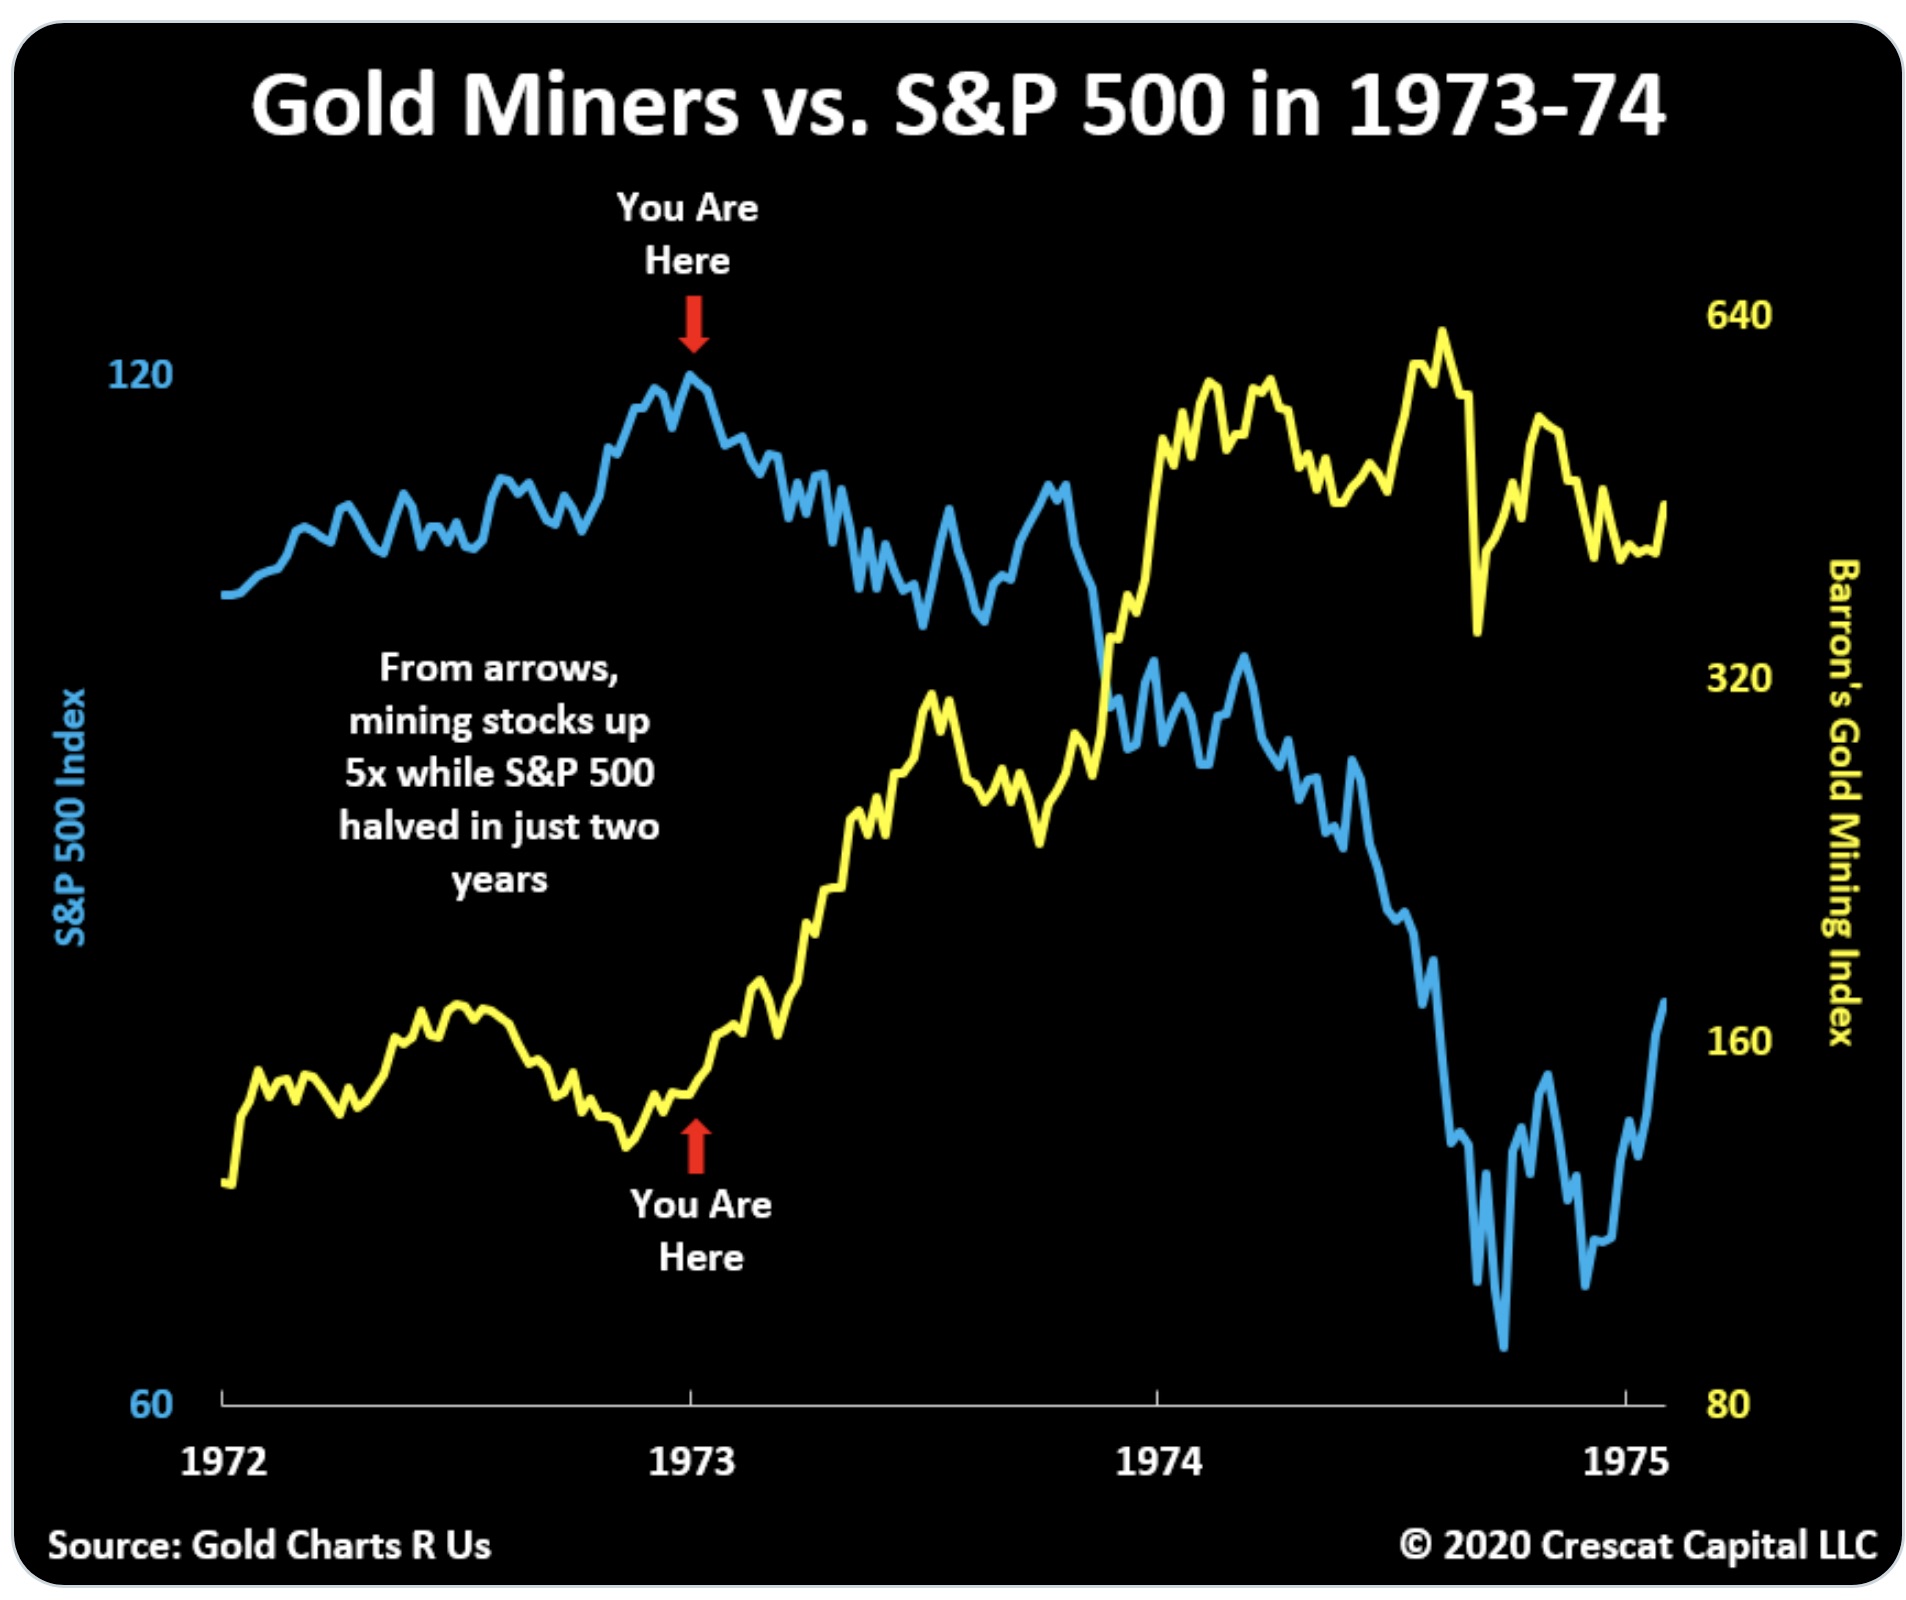
In 1972, investors were crowded into the high P/E Nifty 50. Today, cabals of whales can’t get enough FAANGs and SaaS. In just 2 years, Xerox down 71%, Avon 86%, & Polaroid 91%. Meanwhile, the Barron’s Gold Mining Index went up 5-fold! History doesn’t lie (see chart below):
Mining Stocks Soared During 1973-1974 Bear Market
When The Dow Was Chopped In Half!
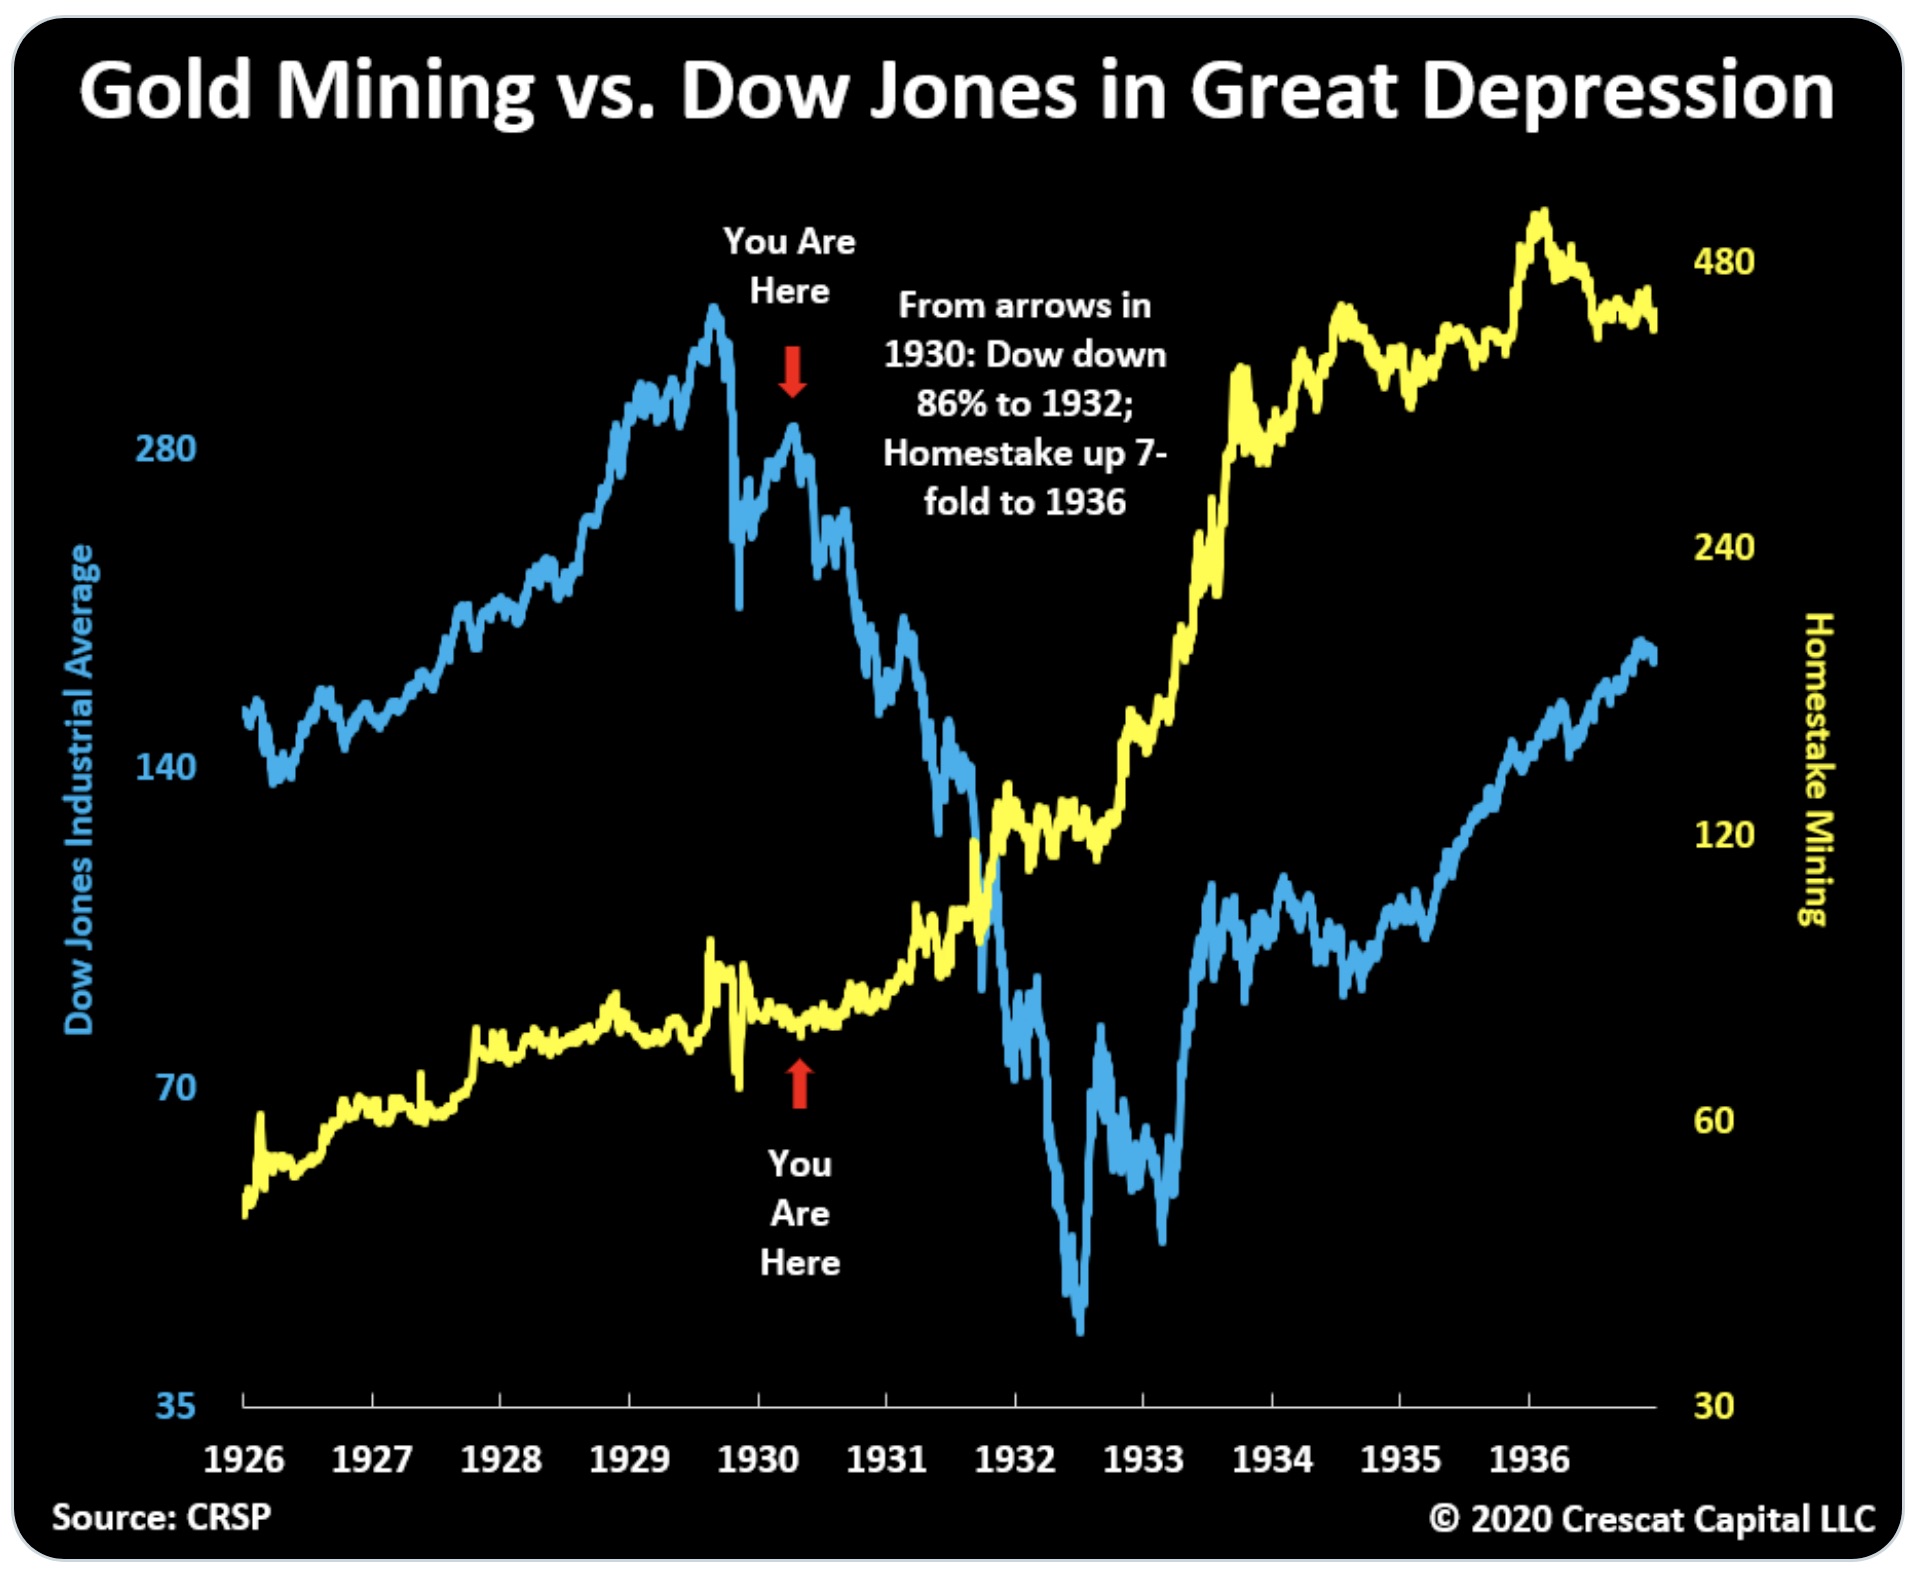
Proof that buying gold miners and shorting overvalued stocks at large can work insanely well on both sides of the hedge even in a deflationary environment. The macro set-up is a speculative debt bubble with record over-valued stocks. (See chart below).
Mining Stocks Soared During The Great Depression!
King World News note: There are so many people around the world that wonder how mining stocks will perform when the stock market collapses. The above three charts illustrate that mining stocks will be trading against the stock market and rising significantly in price as the general stock market plunges. The only exception to this was the liquidity crisis in 2008, and unfortunately that has left a permanent scar on some investors who now believe that mining stocks will decline with the general stock market. History does not support that. That notion is completely false.
If you are wondering what will happen to mining stocks when the...


Add to My Watchlist
What is My Watchlist?
 (20min delay) (20min delay)
|
|||||
|
Last
2.3¢ |
Change
0.000(0.00%) |
Mkt cap ! $33.26M | |||
| Open | High | Low | Value | Volume |
| 2.2¢ | 2.3¢ | 2.2¢ | $196.4K | 8.892M |
Buyers (Bids)
| No. | Vol. | Price($) |
|---|---|---|
| 7 | 3278025 | 2.2¢ |
Sellers (Offers)
| Price($) | Vol. | No. |
|---|---|---|
| 2.3¢ | 1817846 | 5 |
View Market Depth
| Last trade - 16.10pm 12/09/2025 (20 minute delay) ? |
| ARD (ASX) Chart |