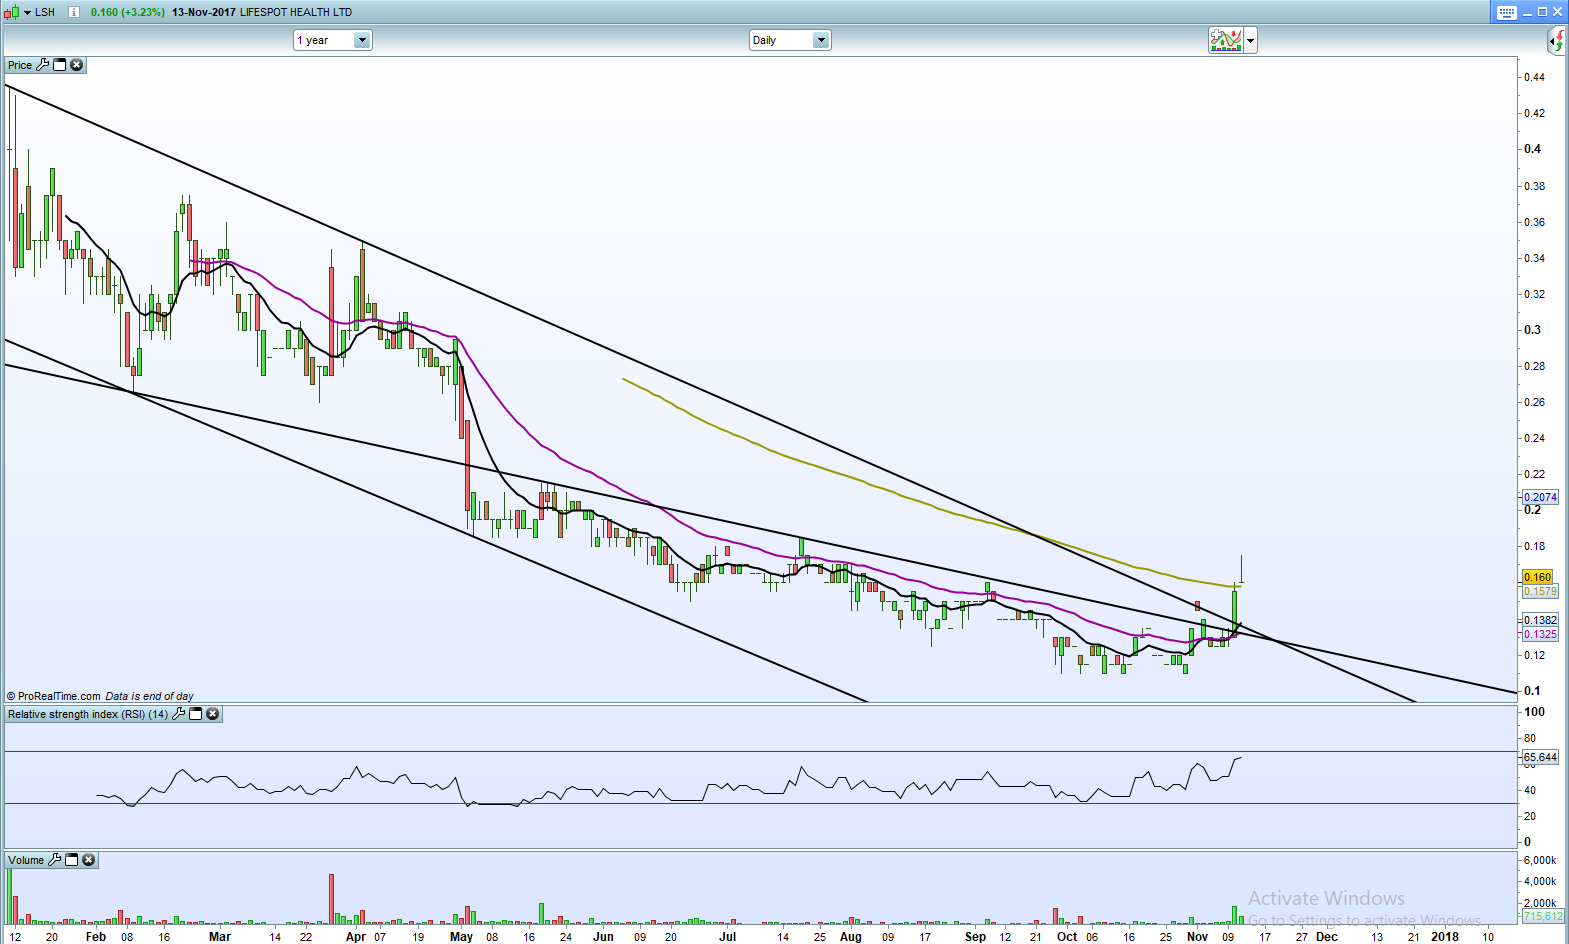
Almost a month later, the chart is looking very different. Has broken out of the two downtrend channels with two very promising high volume days. Profit takers may appear due to buyers from the low 10s being 50% up at this point.
Closes above the downward channel are very positive and an uptrend channel may be drawn soon. Very positive if the volume also continues on green days. Resistance should be around 18.5c and 21.5c. The Geelong update would help a lot at this point to kickstart this recovery. GLTAH
LSH Chart, page-34


Add IRX (ASX) to my watchlist
 (20min delay) (20min delay)
|
|||||
|
Last
3.3¢ |
Change
0.000(0.00%) |
Mkt cap ! $6.262M | |||
| Open | High | Low | Value | Volume |
| 0.0¢ | 0.0¢ | 0.0¢ | $0 | 0 |
Buyers (Bids)
| No. | Vol. | Price($) |
|---|---|---|
| 1 | 45000 | 2.8¢ |
Sellers (Offers)
| Price($) | Vol. | No. |
|---|---|---|
| 3.0¢ | 4400 | 1 |
View Market Depth
| Last trade - 16.12pm 02/10/2024 (20 minute delay) ? |
| IRX (ASX) Chart |
Day chart unavailable