This graph is from the article in the above post. Published on the 10th of feb this year. So a bit out of date now. However it shows the components of inflation. The figures at the end of march were core 6.5%, headline 8.5%.
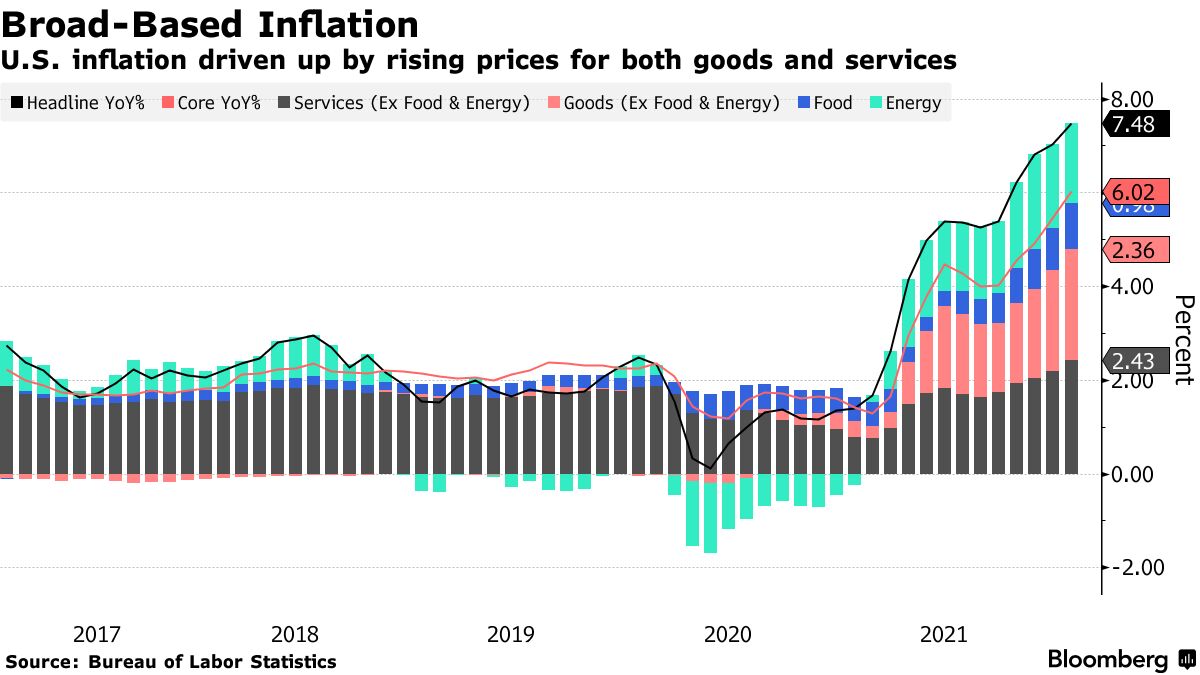
The hope was that goods inflation would start easing as people started to use more services as economies opened up. However, the war and China's latest lockdowns will further delay the easing of supply constraints. The latest bottle neck at the Shanghai port....
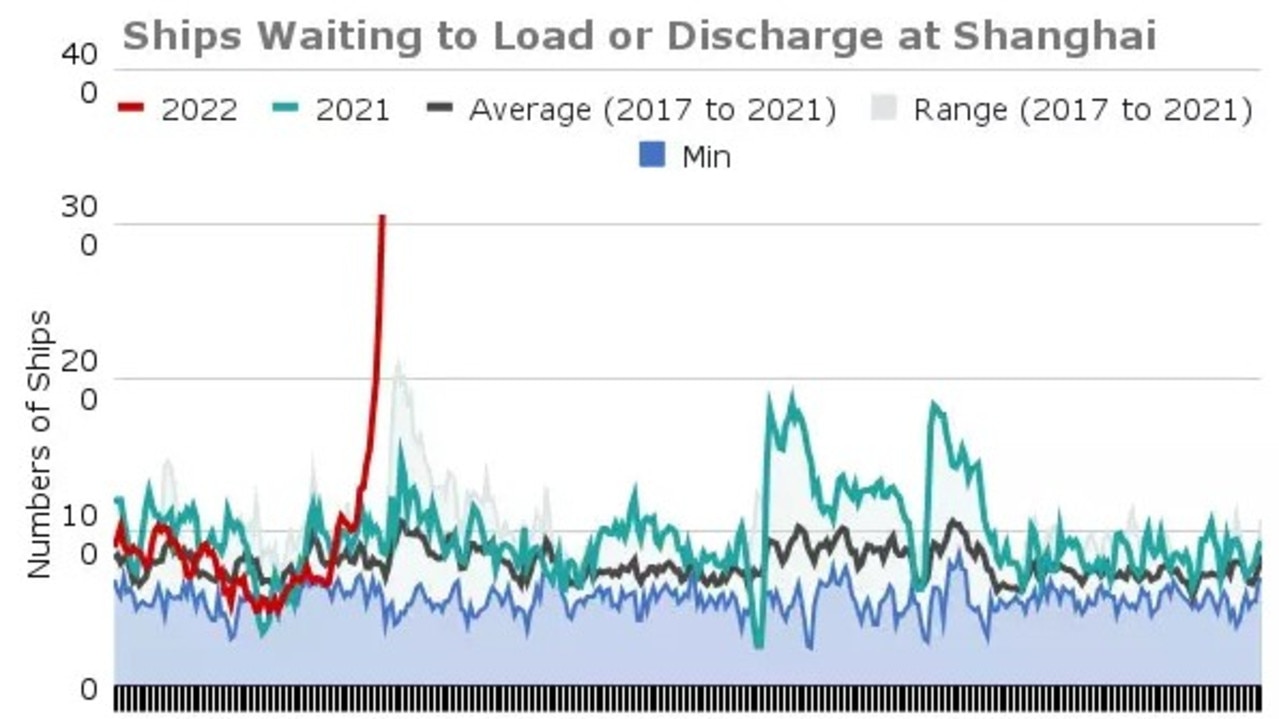
https://www.news.com.au/finance/eco...y/news-story/edf6638554797387f27f04206886f939
So goods inflation is not going to calm anytime soon.
The service side of the economy is people providing services to others. So any wage inflation from very low unemployment rates will drive services inflation. We are seeing that in the US now.
Then energy inflation is not going to calm due to underinvestment in future capacity due to the global ESG supply shift, the war and covid demand supply phase shifts. Energy feeds into food inflation via fertiliser costs.
A further inflationary factor is the widening sread between the short end and long end of the yield cure. Banks take in short deposits and then lend long. So banks have an incentive to lend more, further fueling growth and inflation. The withdrawal of monatary stimulus also adds to growth (I will find and post the article by Ken Fisher that explains that).
The only tool the fed has is to increase the cash rate. The purpose being to eventually choke off credit flow into the economy and induce higher unemployment to calm the wage price inflation spiral. Powell has stated he now wants to "front load" that process.
The following graph will track the progress.
Macro traffic lights - 2022, page-8


Featured News
Featured News
The Watchlist
VMM
VIRIDIS MINING AND MINERALS LIMITED
Rafael Moreno, CEO
Rafael Moreno
CEO
SPONSORED BY The Market Online