for a rather more sane perspective than the one given by the "dailycaller" .........
NOAA temperature record updates and the ‘hiatus’
— gavin @ 4 June 2015
In a new paper in Science Express, Karl et al. describe the impacts of two significant updates to the NOAA NCEI (née NCDC) global temperature series. The two updates are: 1) the adoption of ERSST v4 for the ocean temperatures (incorporating a number of corrections for biases for different methods), and 2) the use of the larger International Surface Temperature Initiative (ISTI) weather station database, instead of GHCN. This kind of update happens all the time as datasets expand through data-recovery efforts and increasing digitization, and as biases in the raw measurements are better understood. However, this update is going to be bigger news than normal because of the claim that the ‘hiatus’ is no more. To understand why this is perhaps less dramatic than it might seem, it’s worth stepping back to see a little context…
Global temperature anomaly estimates are a product, not a measurement
The first thing to remember is that an estimate of how much warmer one year is than another in the global mean is just that, an estimate. We do not have direct measurements of the global mean anomaly, rather we have a large database of raw measurements at individual locations over a long period of time, but with an uneven spatial distribution, many missing data points, and a large number of non-climatic biases varying in time and space. To convert that into a useful time-varying global mean needs a statistical model, good understanding of the data problems and enough redundancy to characterise the uncertainties. Fortunately, there have been multiple approaches to this in recent years (GISTEMP, HadCRUT4, Cowtan & Way, Berkeley Earth, and NOAA NCEI), all of which basically give the same picture.
Composite of multiple estimates of the global temperature anomaly from Skeptical Science.
Once this is understood, it’s easy to see why there will be updates to the historical estimates over time: the raw measurement dataset used can be expanded, biases can be better understood and characterised, and the basic statistical methods for stitching it all together can be improved. Generally speaking these changes are minor and don’t effect the big picture.
Ocean temperature corrections are necessary and reduce the global warming trend
The saga of ocean surface temperature measurements is complicated, but you can get a good sense of the issues by reviewing some of the discussion that followed the Thompson et al. (2008) paper. For instance, “Of buckets and blogs” and “Revisiting historical ocean surface temperatures”. The basic problem is that method for measuring sea surface temperature has changed over time and across different ships, and this needs to be corrected for.
The new NOAA NCEI data is only slightly different from the previous version
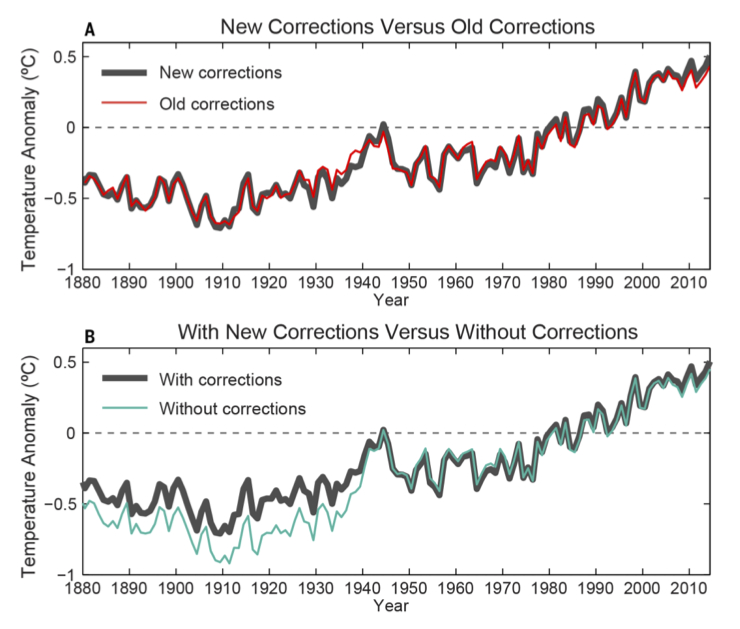
The sum total of the improvements discussed in the Science paper are actually small. There is some variation around the 1940s because of the ‘bucket’ corrections, and a slight increase in the trend in the recent decade:
Figure 2 from Karl et al (2015), showing the impact of the new data and corrections. A) New and old estimates, B) the impact of all corrections on the new estimate.
The second panel is useful, demonstrating that the net impact of all corrections to the raw measurements is to reduce the overall trend.
The ‘hiatus’ is so fragile that even those small changes make it disappear
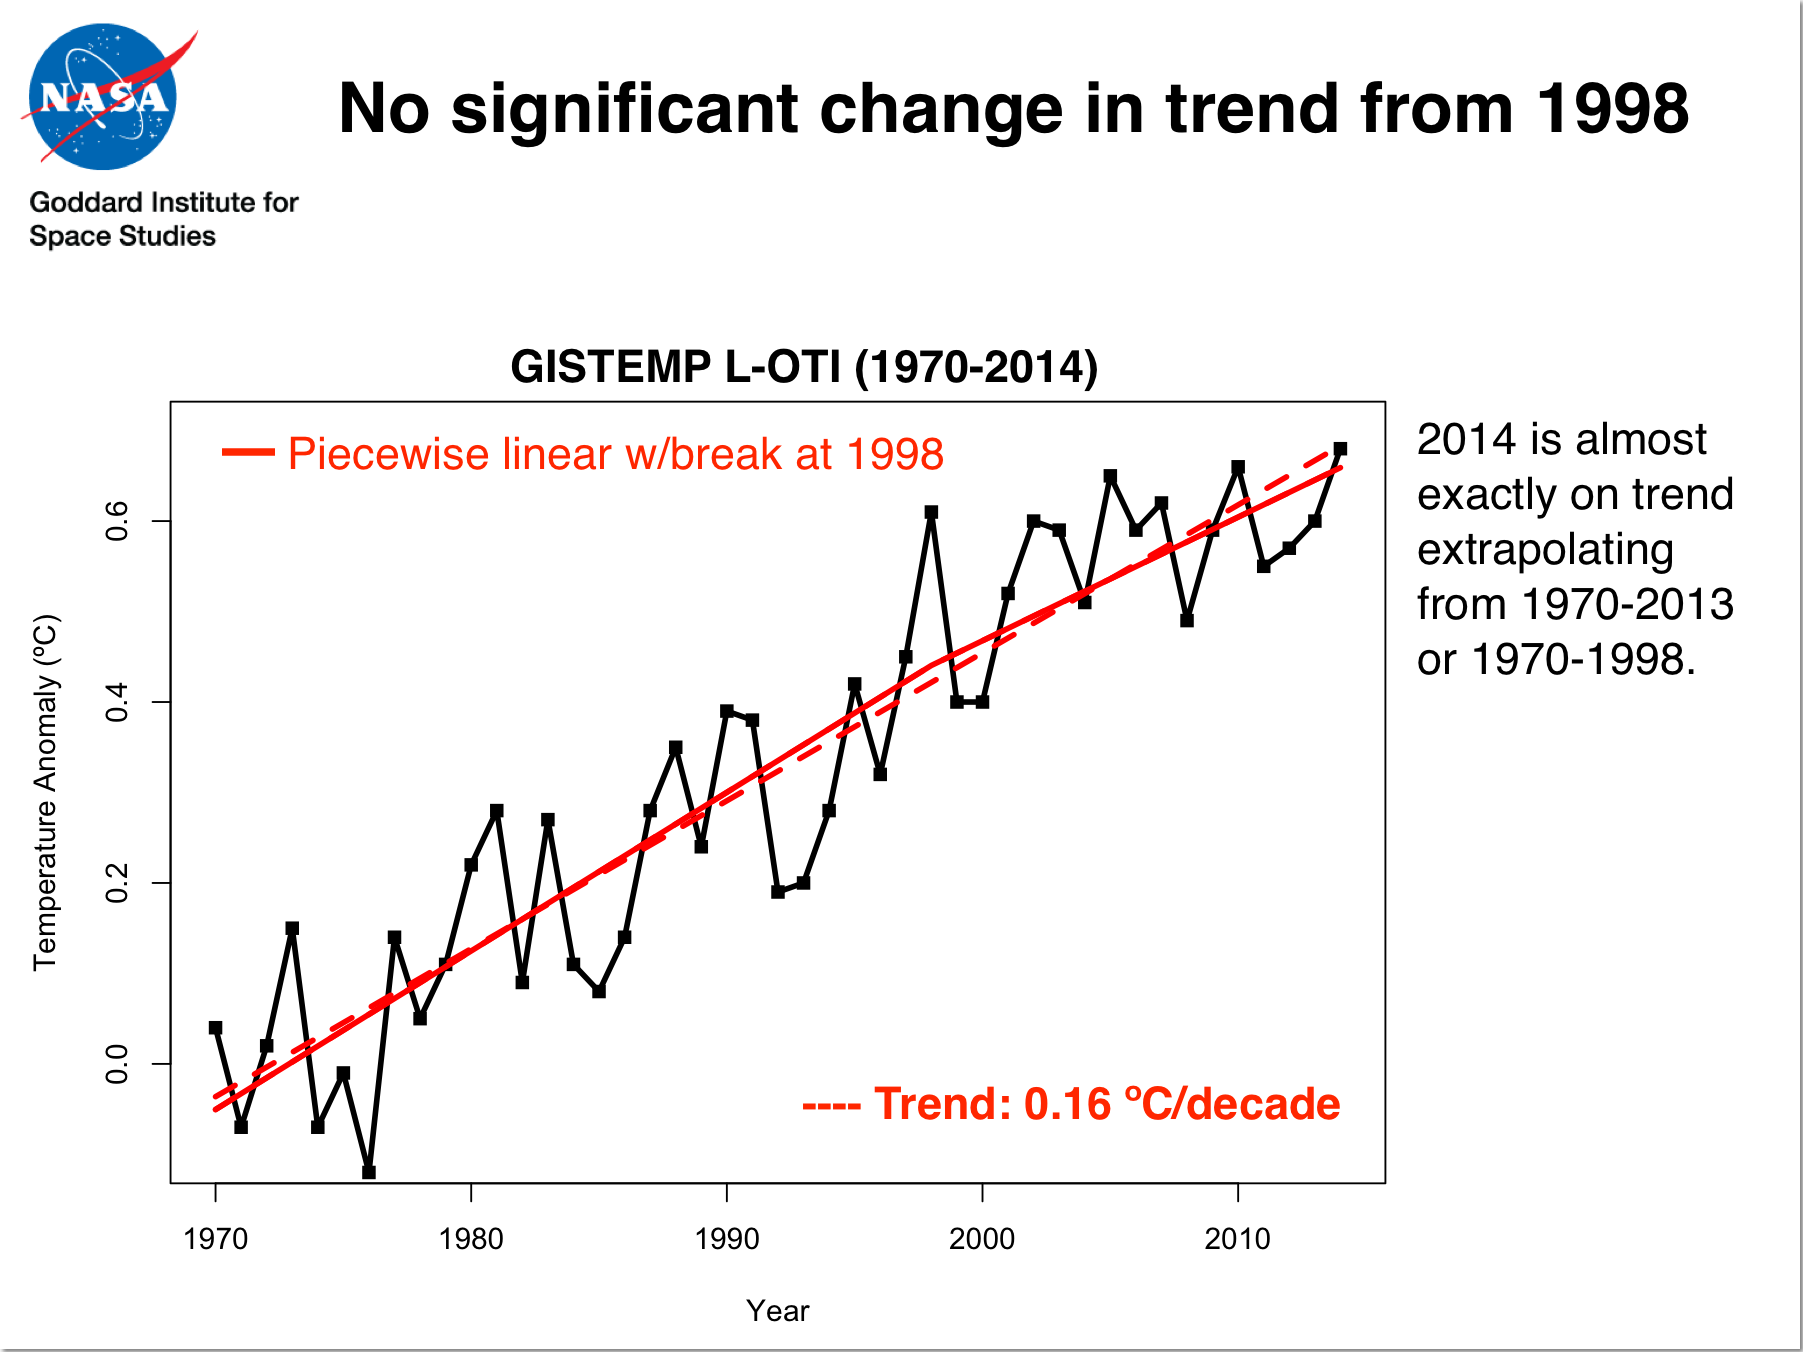
The ‘selling point’ of the paper is that with the updates to data and corrections, the trend over the recent decade or so is now significantly positive. This is true, but in many ways irrelevant. This is because there are two very distinct questions that are jumbled together in many discussions of the ‘hiatus': the first is whether there is any evidence of a change in the long-term underlying trend, and the second is how to attribute short-term variations. That these are different is illustrated by the figure I made earlier this year:
As should be clear, there is no evidence of any significant change in trend post-1997. Nonetheless, if you just look at the 1998-2014 trend and ignore the error bars, it is lower – chiefly as a function of the pattern of ENSO/PDO variability. With the NOAA updates, the recent trends goes from 0.06±0.07 ºC/decade to 0.11±0.07ºC/decade, becoming ‘significant’ at the 95% level. However this is very much an example of where changes in (statistical) significance are not that (practically) significant. Using either record in the same analysis as shown in the last figure would give the same result – that there is no practical or statistical evidence that there has been a change in the underlying long-term trend (see Tamino’s post on this as well). The real conclusion is that this criteria for a ‘hiatus’ is simply not a robust measure of anything.
Model-observation comparisons are not greatly affected by this update
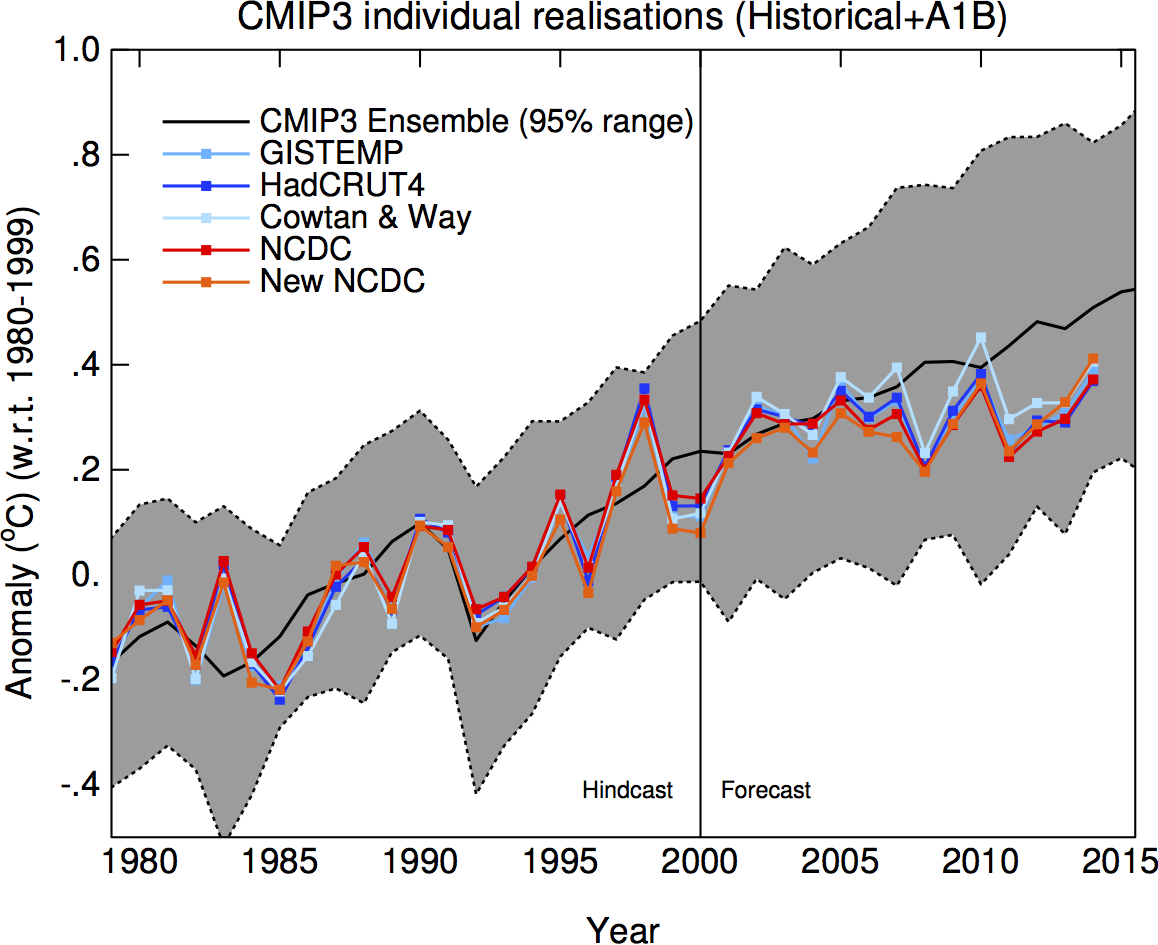
I’ve been remiss in updating these comparisons (see 2012, 2011, and 2010), but this is a good opportunity to do so. First, I show how the CMIP3 model-data comparisons are faring. This is a clean continuation to what I’ve shown before:
It is clear that temperatures are well within the expected range, regardless of the NCDC/NCEI version. Note that the model range encompasses all of the simulated internal variability as well as an increasing spread over time which is a function of model structural uncertainty. These model simulations were performed in 2004 or so, using forcings that were extrapolated from 2000.
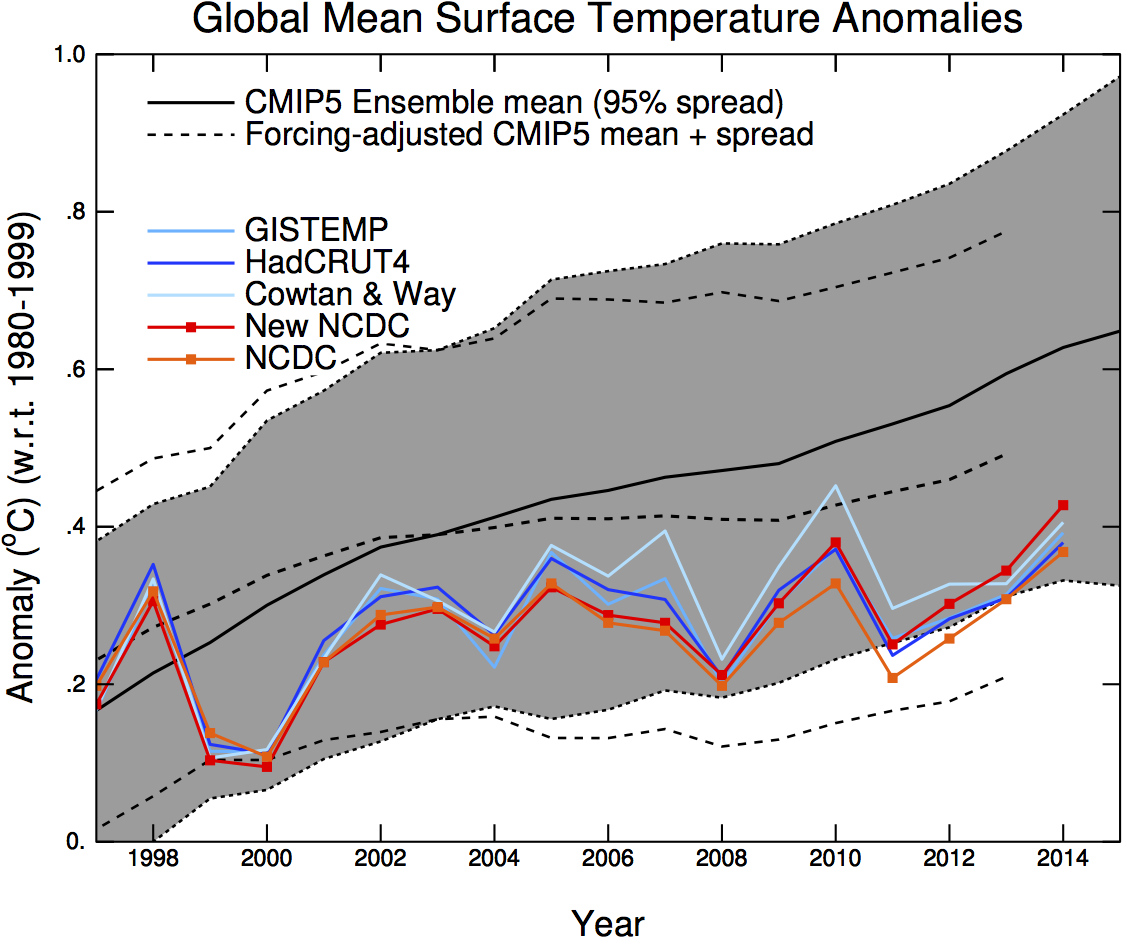
More recently (around 2011) a wider group of centers and with more, and more up-to-date models, performed the CMIP5 simulations. The basic picture is similar over the 1950 to present range or looking more closely at the last 17 years:
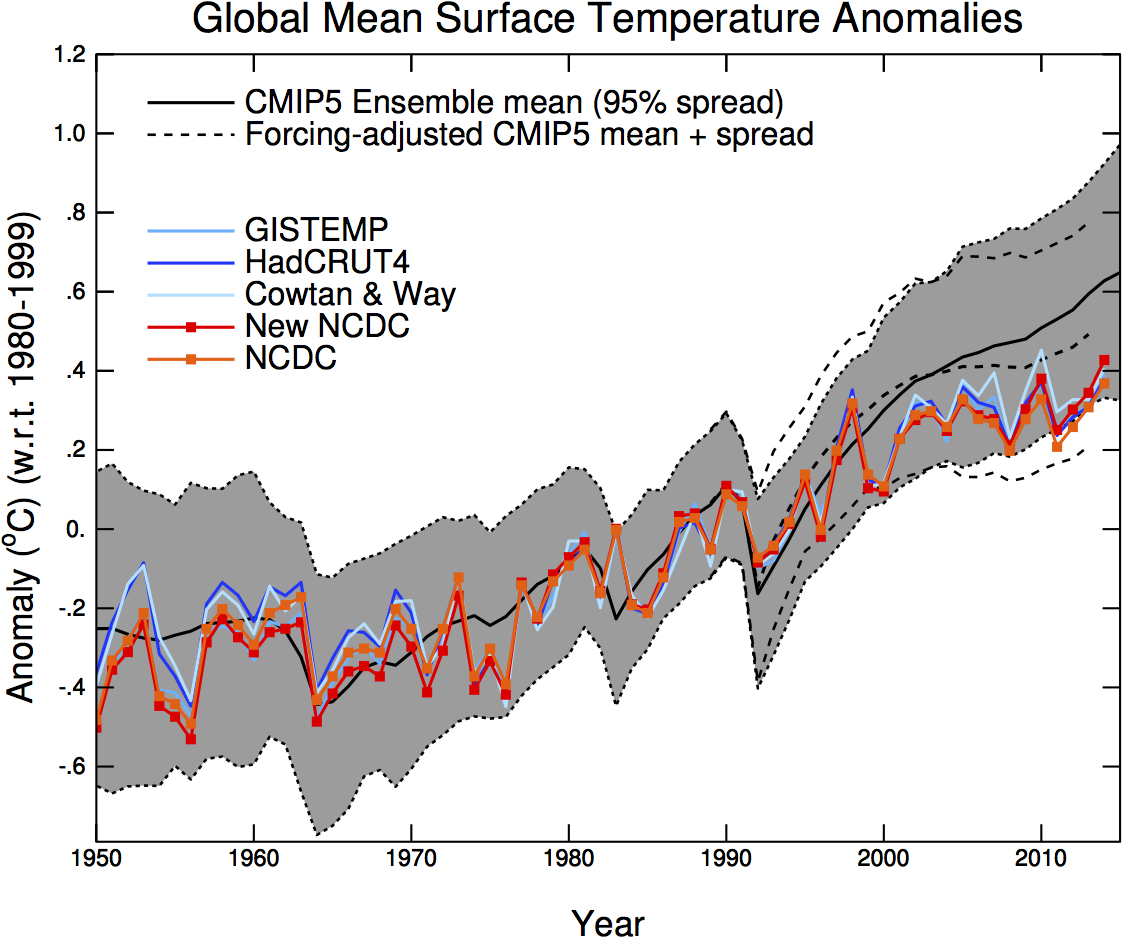
The current temperatures are well within the model envelope. However, I and some colleagues recently looked closely at how well the CMIP5 simulation design has held up (Schmidt et al., 2014) and found that there have been two significant issues – the first is that volcanoes (and the cooling associated with their emissions) was underestimated post-2000 in these runs, and secondly, that solar forcing in recent years has been lower than was anticipated. While these are small effects, we estimated that had the CMIP5 simulations got this right, it would have had a noticeable effect on the ensemble. We illustrate that using the dashed lines post-1990. If this is valid (and I think it is), that places the observations well within the modified envelope, regardless of which product you favour.
The contrary-sphere really doesn’t like it when talking points are challenged
The harrumphing from the usual quarters has already started. The Cato Institute sent out a pre-rebuttal even before the paper was published, replete with a litany of poorly argued points and illogical non-sequiturs. From the more excitable elements, one can expect a chorus of claims that raw data is being inappropriately manipulated. The fact that the corrections for non-climatic effects reduce the trend will not be mentioned. Nor will there be any actual alternative analysis demonstrating that alternative methods to dealing with known and accepted biases give a substantially different answer (because they don’t).
The ‘hiatus’ is no more?
Part of the problem here is simply semantic. What do people even mean by a ‘hiatus’, ‘pause’ or ‘slowdown’? As discussed above, if by ‘hiatus’ or ‘pause’ people mean a change to the long-term trends, then the evidence for this has always been weak (see also this comment by Mike). If people use ‘slowdown’ to simply point to a short-term linear trend that is lower than the long-term trend, then this is still there in the early part of the last decade and is likely related to an interdecadal period (through at least 2012) of more La Niña-like conditions and stronger trade winds in the Pacific, with greater burial of heat beneath the ocean surface.
So while not as dead as the proverbial parrot, the search for dramatic explanations of some anomalous lack of warming is mostly over. As is common in science, anomalies (departures from expectations) are interesting and motivating. Once identified, they lead to a reexamination of all the elements. In this case, there has been an identification of a host of small issues (and, in truth, there are always small issues in any complex field) that have involved the fidelity of the observations (the spatial coverage, the corrections for known biases), the fidelity of the models (issues with the forcings, examinations of the variability in ocean vertical transports etc.), and the coherence of the model-data comparisons. Dealing with those varied but small issues, has basically lead to the evaporation of the original anomaly. This happens often in science – most anomalies don’t lead to a radical overhaul of the dominant paradigms. Thus I predict that while contrarians will continue to bleat about this topic, scientific effort on this will slow because what remains to be explained is basically now well within the bounds of what might be expected.
- See more at: http://www.realclimate.org/index.ph...-updates-and-the-hiatus/#sthash.yqfcrLYe.dpuf
for a rather more sane perspective than the one given by the...


Featured News
Featured News
The Watchlist
VMM
VIRIDIS MINING AND MINERALS LIMITED
Rafael Moreno, CEO
Rafael Moreno
CEO
SPONSORED BY The Market Online