Edwin X Berry, Montana, USA – 2022-08-02
Copyright (c) 2022 by Edwin X Berry. Permission granted to republish with link to Berry (2021).
Introduction
This summary of Berry (2021) shows the main points without the math.
1. How CO2 flows out of the atmosphere.
The Intergovernmental Panel on Climate Change (IPCC) correctly assumes the outflow of CO2 from the atmosphere is proportional to the CO2 level divided by a time constant.
This time constant – that the IPCC calls “turnover time” and we call “e-time” – describes how fast CO2 flows out of the atmosphere.
IPCC (2007, p. 948) defines “turnover time” equal to the first power of the carbon level divided by the outflow of carbon from the reservoir,
“Turnover time (T) is the ratio of the mass M of a reservoir (e.g., a gaseous compound in the atmosphere) and the total rate of removal S from the reservoir: T = M / S. For each removal process, separate turnover times can be defined.”
IPCC (2007, p. 948) says the turnover time (T) for natural CO2 is about four years.
“Carbon dioxide (CO2) is an extreme example. Its turnover time is only about four years because of the rapid exchange between the atmosphere and the ocean and terrestrial biota.”
IPCC’s data for its natural carbon cycle (IPCC, 2013, p. 470-471) show the e-time for atmospheric CO2 is 3.5 years, supporting IPCC’s statement of “about four years.”
Simple physics shows when outflow is proportional to the first power of level, natural and human carbon cycles are independent. So, we can calculate these carbon cycles independently and then add them up to get the total. We need only to calculate the human carbon cycle over time to see how human CO2 changes atmospheric CO2.
2. The first approximation conflicts with IPCC claims.
IPCC’s data show the inflow of human CO2 into the atmosphere is about 5% of the total CO2 inflow and natural CO2 is about 95%.
Since human and natural CO2 molecules are identical, their e-times are identical. Therefore, to the first approximation, the composition of today’s atmospheric CO2 is about 5% human and 95% natural.
Yet, IPCC (2013, p. 467, Executive Summary) says,
“With a very high level of confidence, the increase in CO2 emissions from fossil fuel burning and those arising from land use change are the dominant cause of the observed increase in atmospheric CO2 concentration.”
IPCC (2013, pp. 470-471) assumes the natural CO2 level remained at 280 ppm after 1750 and, therefore, human CO2 caused all the CO2 increase since 1750. This would make human CO2 about 32% of 415 ppm as of 2020.
How can a 5% inflow cause 32% of the CO2 level?
It can’t. Even the IPCC realizes this problem. So, to support its claim that human CO2 causes dangerous climate change, the IPCC incorrectly claims human CO2 stays in the atmosphere longer than natural CO2.
IPCC (2013, p. 469) incorrectly claims:
“The removal of human-emitted CO2 from the atmosphere by natural processes will take a few hundred thousand years (high confidence). … about 15 to 40% of emitted CO2 will remain in the atmosphere longer than 1,000 years. This long time required … to remove anthropogenic CO2 makes climate change caused by elevated CO2 irreversible on human time scale.”
This IPCC claim violates IPCC’s own data-based e-time and ignores that human and natural CO2 molecules are identical, and therefore their e-times are identical.
3. The second approximation proves the IPCC is wrong.
The first approximation considered only the atmosphere. The second approximation uses IPCC’s four-reservoir carbon cycle model. The physics model, using outflow proportional to level and IPCC’s e-times, replicates IPCC’s natural carbon cycle, shown in Figure 1.
Then, this same model calculates a human carbon cycle compatible with IPCC’s natural carbon cycle, using recursive, annual time steps from 1750 to 2020, shown Figure 2.
This compatible human carbon cycle shows human CO2 has added only 33 ppm (8%) while nature has added 100 ppm (92%) to IPCC’s 280 ppm level in 1750, as of 2020.
According to the scientific method, the physics model has proved IPCC’s claim – that human CO2 caused all the CO2 increase above 280 ppm – is false.
Good high-school students can learn how the physics model works.
4. IPCC’s natural carbon cycle
Figure 1 shows IPCC’s natural carbon cycle at equilibrium with atmospheric CO2 at 280 ppm (589 PgC). The boxes show reservoirs and arrows the flows between reservoirs.
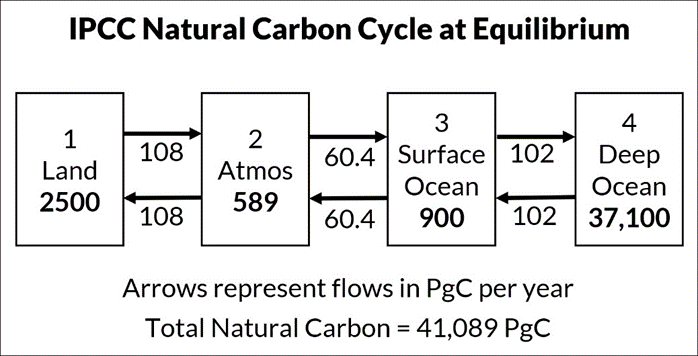
Figure 1. Levels and flows for IPCC’s (2013) natural carbon cycle.
Figure 1 shows 1.4% of natural carbon is in the atmosphere and 90% is in the deep ocean. This is an equilibrium fingerprint that human carbon will approach.
5. Physics model applied to human carbon.
Figure 2 shows the physics carbon cycle model with IPCC’s four reservoirs and six outflows, where the arrows are all positive numbers.

Figure 2. The human carbon cycle model uses the same physics as IPCC’s natural carbon cycle but adds the annual inflow of human carbon.
Human carbon has added only one percent to the total carbon in the natural carbon cycle.
Figure 3 shows how the reservoir levels change with time for human carbon.
The purple dashed line shows the cumulative human carbon since 1750. The solid bold line shows the measured atmospheric carbon level above 280 ppmv.
Data alone prove natural CO2 increased the CO2 level above 280 ppm. The cumulative “New Human carbon added” before 1955 is less than measured “atmospheric carbon,” making it impossible for human carbon to have caused all the CO2 increase.
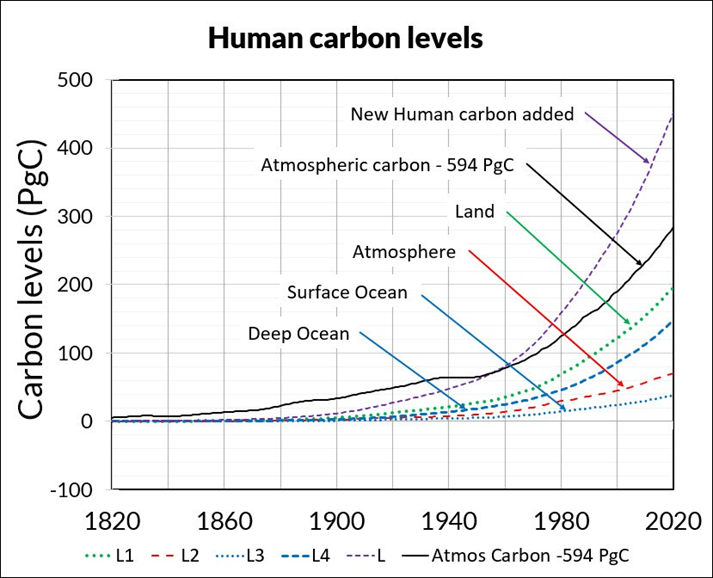
Figure 3. How human carbon levels change with time.
The red dashed line shows human CO2 added to the atmosphere is much less than the “New Human carbon added” because the CO2 e-time of 3.5 years lets CO2 flow out of the atmosphere much faster than it can accumulate.
6. The Bern model uses IPCC’s assumption.
Figure 4 compares the physics model with the Bern model.
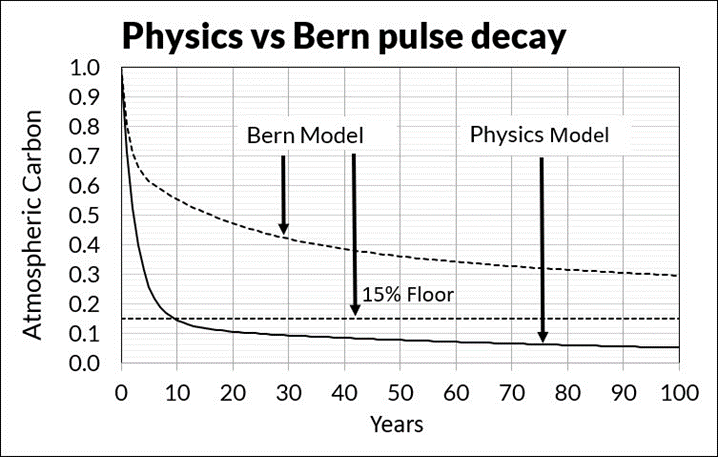
Figure 4. Pulse decay by the physics model and the Bern model.
The key difference between the Bern model and the physics model is the Bern model uses IPCC’s invalid assumption that human CO2 causes all the CO2 increase while the physics model uses IPCC’s e-time of 3.5 years.
7. Isotope data show CO2 increase is natural.
Figure 5 shows
- 14C data (black solid line) and its curve fit after 1970 (black dashed line).
- 14C data relative to the δ14C value in 1970 (blue sawtooth line) and its curve fit.
- 12CO2 data in ppmv (red sawtooth line).
δ14C is a measure of the 14/ 12C ratio. The natural level of δ14C is zero.
Human CO2 has no 14C, so its δ14C is -1000. If human CO2 were 32% of the CO2 in the
atmosphere, it would dilute the natural δ14C level from zero to -320.
Data show δ14C has returned to its natural level of zero even as 12C (red line) has increased, showing that natural CO2 has dominated the increase in atmosphere CO2.
The 14C curve fit shows 14CO2 e-time is 10.0 years (Hardy and Salby, 2021; Berry, 2021).
The 12CO2 e-time is smaller than the 14CO2 e-time because the atom is heavier than
the 12C atom. This confirms that the e-time for 12CO2 is less than 10.0 years.
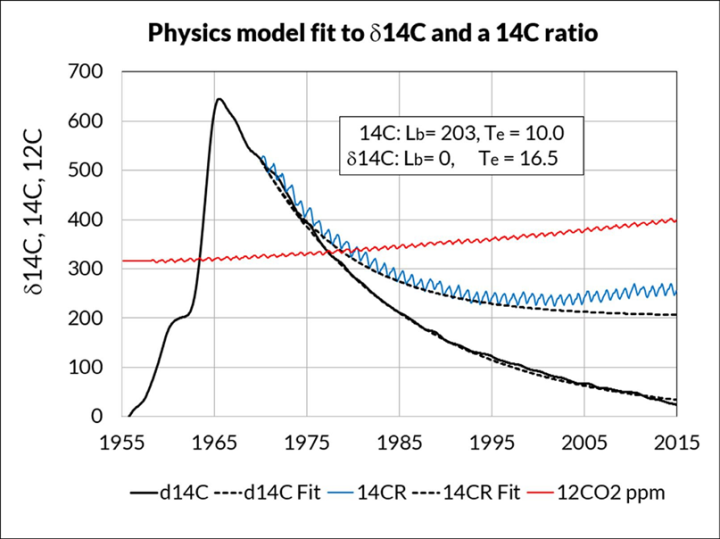
Figure 5. δ14C data (black line) and its curve fit (black dashed line), relative (blue sawtooth line) and its curve fit (black dashed line), and 12CO2 ppmv (red line).
Conclusions
The simple physics model – using IPCC’s outflow proportional to level and e-times –proves natural CO2 controls atmospheric CO2. As of 2020, natural CO2 has added about 100 ppm, and human CO2 only 33 ppm, to IPCC’s CO2 level of 280 ppm in 1750.
References
Berry, E. X, 2021: The impact of human CO2 on atmospheric CO2. Science of Climate Change, December 14, 2021, The impact of human CO2 on atmospheric CO2 – SCC (klimarealistene.com); https://doi.org/10.53234/scc202112/212
Harde, H. and Salby, M. L., 2021: What Controls the Atmosphere CO2 Level? Science of Climate Change, August 2021. https://doi.org/10.53234/scc202111/28. https://scc.klimarealistene.com/produkt/what-controls-the-atmospheric-CO2- level/
IPCC, 2013: Ciais, P., Sabine, et al. 2013: Carbon and Other Biogeochemical Cycles. The Physical Science Basis. Contribution of Working Group I to the Fifth Assessment Report of the IPCC. Cambridge University Press, UK and New York, NY, USA.
IPCC. 2007: Climate Change 2007 – The Physical Science Basis. Contribution of Working Group 1 to the Fourth Assessment Report of the IPCC. Annex 1: Glossary: Lifetime. https://www.ipcc.ch/site/assets/uploads/2018/02/ar4-wg1-annexes-1.pdf


