What The Science Says:
The most likely reason that UAH data shows less warming than expected is that the UAH data set is biased low.Climate Myth: UAH atmospheric temperatures prove climate models and/or surface temperature data sets are wrong
the satellite sensors show less warming in the lower troposphere (approximately 10,000 feet above the earth’s surface) than is reported by surface temperature readings. Global warming theory holds that one of the fingerprints of human-induced global warming is more rapid warming in the lower troposphere than at the surface (James Taylor)
Climate models predict, that as a consequence of global warming, the temperature of the lower troposphere (TLT) will warm about 20% faster than the Earth's surface temperature. On the contrary, TLT as computed byRoy SpencerandJohn Christyat the University of Alabama at Huntsville (UAH)is warming about 20% more slowly than the surface, as measured by groups like NASA Goddard Institute for Space Studies (GISS) and the National Oceanic and Atmospheric Administration (NOAA). There are three possible explanations for this model-data discrepancy:
- The models are wrong and the lower atmosphere should not warm faster than the surface.
- The surface temperature estimates are biased high, showing more warming than is actually occurring.
- The TLT estimates are biased low, showing less warming than is actually occurring.
The answer may also involve a combination of these three possibilities. But which is most likely?
The climate model expectation of greater warming in the lower atmosphere isbased on fundamental atmospheric physics, so this may be the least likely explanation for the discrepancy. There are also several surface temperature data sets which are all in very close agreement, and whose accuracy was recentlyindependently confirmed by the Berkeley Earth Surface Temperature (BEST) project, so the second possible explanation also appears rather unlikely.
However, UAH is not the only group using satellite data to measure atmospheric temperatures. There are several other groups who have performed similar analyses of the data, andwho generally estimate greater atmospheric warming than UAH. Moreover, atmospheric temperature estimates from instruments on weather balloons also indicate more warming than has been computed from the UAH record.
Estimating atmospheric temperatures from satellite data is a tricky business. The microwave sounding units (MSU) aboard the satellites don't actually measure air temperature, but rather the intensity of microwave radiation given off by oxygen molecules in the atmosphere, from which the scientists estimate the temperature. Given that the radiation reaches the satellite sensors having travelled through awarming lower atmosphere and cooling upper atmosphere, that bias exists between the various instrument sensors, that the orbital decay of the satellite creates another bias in the data, and a host of other obstacles, there's a lot of careful and painstaking analysis required, and much that can go wrong.
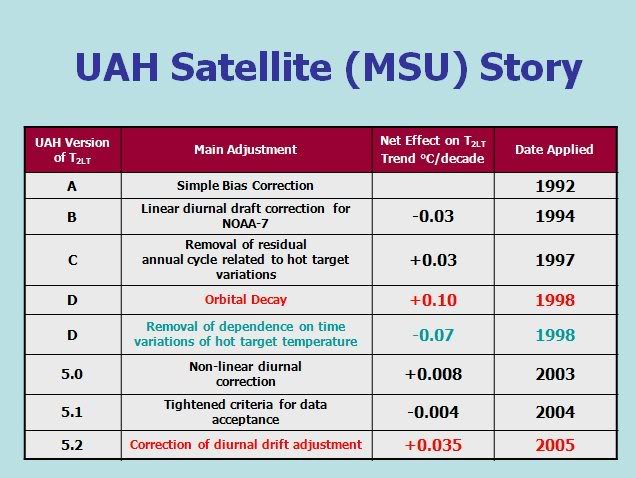
Considering these challenges, it's not a surprise that there have been a number of major corrections to the satellite temperature data over the years. Groups outside of UAH identified two major errors in the UAH analysis,both of which had caused Spencer and Christy to significantly underestimate TLT warming(Figure 1).
Figure 1: Major corrections to the UAH temperature trend over the years.
Despite the difficulties in the available data, and the numerous adjustments made to their analysis,Spencer and Christy have all along insisted that their data set is correct, and they continue with this overconfidence today. However, the most likely explanation for UAH showing less warming than models and atmospheric physics predict is that UAH is biased low.
https://skepticalscience.com/uah-atmospheric-temperatures-prove-climate-models-and-or-surface-temperature-measurements-are-wrong.htmUAH satellite temperature dataset
1 languagehttps://en.wikipedia.org/wiki/UAH_satellite_temperature_dataset#:~:text=The%20UAH%20satellite%20temperature%20dataset,Microwave%20Sounding%20Unit%20temperature%20measurements.From Wikipedia, the free encyclopediaTheUAH satellite temperature dataset, developed at theUniversity of Alabama in Huntsville, infers the temperature of various atmospheric layers fromsatellitemeasurements of the oxygenradiancein the microwave band, usingMicrowave Sounding Unit temperature measurements.
It was the first global temperature datasets developed from satellite information and has been used as a tool for research into surface and atmospheric temperature changes. The dataset is published byJohn Christyet al. and formerly jointly withRoy Spencer.
Satellite temperature measurements[edit]
Main article:Satellite temperature measurementsSatellitesdo not measuretemperaturedirectly. They measureradiancesin variouswavelengthbands, from which temperature may beinferred.[1][2]The resulting temperature profiles depend on details of the methods that are used to obtain temperatures from radiances. As a result, different groups that have analyzed the satellite data have obtained different temperature data (seeMicrowave Sounding Unit temperature measurements). Among these groups areRemote Sensing Systems(RSS) and theUniversity of Alabama in Huntsville(UAH). The satellite series is not fully homogeneous - it is constructed from a series of satellites starting with the 1978TIROS-N, where different satellites had similar but not identical instrumentation. The sensors deteriorate over time, and corrections are necessary for satellite drift and orbital decay. Particularly large differences between reconstructed temperature series occur at the few times when there is little temporal overlap between successive satellites, making intercalibration difficult.
Description of the data[edit]
The UAH dataset is produced by one of the groups reconstructing temperature from radiance.
UAH provide data on three broad levels of the atmosphere.
- The Lowertroposphere-TLT(originally calledT2LT).
- The mid troposphere -TMT
- The lower stratosphere -TLS[3]
Data are provided astemperature anomaliesagainst the seasonal average over a past basis period, as well as in absolute temperature values. The baseline period for the published temperature anomalies was changed in January 2021 from 1981-2010 to 1991-2020.[4]
All the data products can be downloaded from the UAH server.[5]
Recent trend summary[edit]
To compare to the trend from thesurface temperature record(+0.161±0.033 °C/decade from 1979 to 2012 according to NASA GISS[6]) it is most appropriate to derive trends for the part of the atmosphere nearest the surface,i.e., the lowertroposphere. Doing this, through December 2019, the UAH linear temperature trend 1979-2019 shows a warming of +0.13 °C/decade.[7][8]
For comparison, a different group,Remote Sensing Systems(RSS), also analyzes the MSU data. From their data: the RSS linear temperature trend shows a warming of +0.208 °C/decade.[9][10]
Geographic coverage[edit]
Data are available as global, hemispheric, zonal, and gridded averages. The global average covers 97-98% of the earth's surface, excluding only latitudes above +85 degrees, below -85 degrees and, in the cases of TLT and TMT, some areas with land above 1500 m altitude. The hemispheric averages are over the northern and southern hemispheres 0 to +/-85 degrees. The gridded data provide an almost global temperature map.[3]
Temporal coverage[edit]
Daily global, hemispheric and zonal data are available. Monthly averages are available in gridded format as well as by hemisphere and globally.
Each set has data back to December 1978.
Comparison with other data and models[edit]
Main article:Microwave Sounding Unit temperature measurements § Comparison of data with climate modelsIn comparing these measurements to surface temperature models, it is important to note that values for the lower troposphere measurements taken by the MSU are a weighted average of temperatures over multiple altitudes (roughly 0 to 12 km), and not a surface temperature (see figure inMicrowave Sounding Unit temperature measurementsarticle). The results are thus not precisely comparable to surface temperature records or models.
Pre-1998 results published by UAH showed no warming of the atmosphere. In a 1998 paper, Wentz and Schabel showed this (along with other discrepancies) was due to the orbital decay of the NOAA satellites.[11]With these errors corrected, the UAH data showed a 0.07 °C/decade increase in lower troposphere temperature.
Some discrepancies between the UAH temperature measurements and temperatures measured by other groups remain, with (as of 2019) the lower troposphere temperature trend from 1979-2019 calculated as +0.13 °C/decade by UAH,[7][8]and calculated at +0.208 °C/decade by RSS.[9][10]
A more detailed discussion can be found in theComparison with surface trendssection of theMicrowave Sounding Unit temperature measurementsarticle.
Corrections made[edit]
The table below summarizes the adjustments that have been applied to the UAH TLT dataset.[12][13]The 'trend correction' refers to the change in global mean decadal temperature trend in degrees Celsius/decade as a result of the correction.
UAH version Main adjustment Trend correction Year 1 A Simple bias correction 1992 2 B Linear diurnal drift correction -0.03 1994 3 C Removal of residual
annual cycle related to
hot target variation0.03 1997 4 D Orbital decay 0.10 1998 5 D Removal of dependence
of time variations of
hot target temperature-0.07 1998 6 5.0 Non-linear diurnal correction 0.008 2003 7 5.1 Tightened criteria for data acceptance -0.004 2004 8 5.2 Correction of diurnal drift adjustment 0.035 2005 9 5.3 Annual cycle correction 0 2009 10 5.4 New annual cycle 0 2010 11 6.0 beta Extensive revision -0.026[14] 2015 NOAA-11 played a significant role in a 2005 study by Mearset al.identifying an error in the diurnal correction that leads to the 40% jump in Spencer and Christy's trend from version 5.1 to 5.2.[15]
Christyet al.asserted in a 2007 paper that the tropical temperature trends fromradiosondesmatches more closely with their v5.2 UAH-TLT dataset than with RSS v2.1.[16]
Much of the difference, at least in the Lower troposphere global average decadal trend between UAH and RSS, had been removed with the release of RSS version 3.3 in January 2011, at which time the RSS and UAH TLT were now within 0.003 K/decade of one another. Significant differences remained, however, in the Mid Troposphere (TMT) decadal trends. However, in June 2017 RSS released version 4 which significantly increased the trend from 0.136 to 0.184 K/decade substantially increasing the difference again.
A beta version of 6.0 of the dataset was released on April 28, 2015 via blog post.[14]This dataset has higher spatial resolution and uses new methods for gridpoint averaging.
Manmade Global Warming - New Extremes, page-7227


Featured News
Featured News
The Watchlist
NUZ
NEURIZON THERAPEUTICS LIMITED
Dr Michael Thurn, CEO & MD
Dr Michael Thurn
CEO & MD
SPONSORED BY The Market Online