Just another observation on the latest price action for this week...
Negatives:
The price is currently below the linear regression value.
MACD is in bearish territory. Further, CCC just put in a 45 bar new low. More lows are possible here.
MFI suggests more lows are possible.
Momentum and Rate of Change are both in bearish territories.
TRIX is in bearish territory and more lows are possible here.
The current new low is accompanied by increasing volume, suggesting further new lows are ahead. (volume indicator)
Volume Average - The current new low and downward average are accompanied by volume that is above the average volume, suggesting some strength behind the current move.
The Volume Oscillator indicates a continued selloff is likely. And the same goes for the Volume Rate of Change..
MACD is in bearish territory and more lows are possible.
ADX suggests the current downtrending market to continue.
DMI is in bearish territory.
Positives:
On Balance Volume indicates a rally is likely.
The Parabolic indicator is showing some weakening in the downtrend.
RSI (28.03) has issued a bullish signal.
The swing index has crossed over zero, issuing a short term bullish signal.
REI is in oversold territory and its value is still declining. Generally suggests to expect the SP to turn up soon..
The Ultimate Oscillator indicates a rally is likely.
The volatility trend based on a 9 bar moving average has just turned up.
Conclusion:
From what I can gather, the negative indicators are arguing with the positive ones (kind of like whats happened here), and may erupt in a violent brawl lol...
It's generally safest to wait until they're in agreement. It will be choppy for a while till they can sort things out.
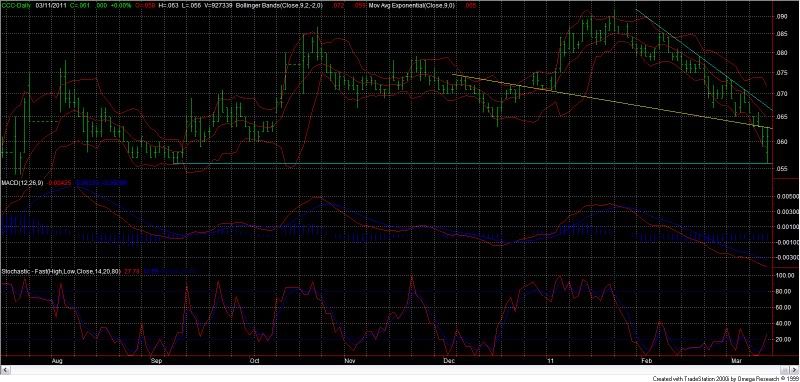
Me thinks if the SP breaks above 6.3, it will be met with heavy resistance at 6.8/6.9. I would wait for the share price to trade above these levels (at this point in time) before considering an entry.. (post reversal)
If 5.6 gets breached, the next level of support will be at 5.2, after that it's at around 4.6/4.8 imho...
The daily chart below shows a descending triangular formation (cyan trend lines) with (now) a 3 point support line at 5.6. It also shows the breach of a descending wedge (yellow and upper cyan trend lines) with the current short term resistance being 6.3. A double-top has also formed at that point.
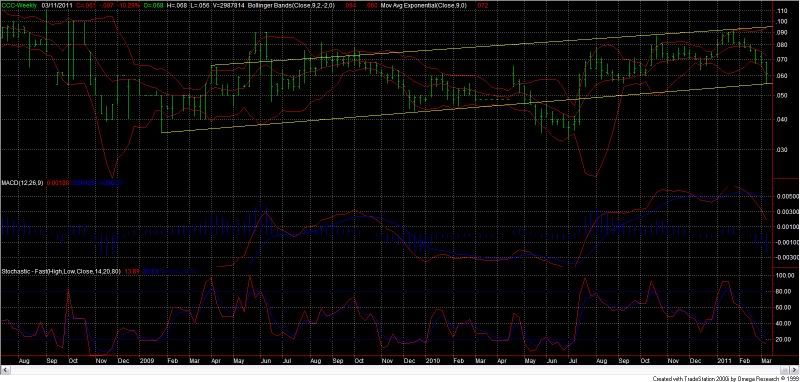
The weekly chart shows today's low (5.6) is at the bottom point of an ascending channel..
May support be sustained already!
Add to My Watchlist
What is My Watchlist?


