The writing was all over the walls that 2007 was the year of living dangerously for the stockmarket.
Here's a conclusion i have arrived at with XAO the gives me plenty of long term comfort ... and 'plenty' of disappointment in not being able to see it while it was happening. anyhow, what doesn't kill you ...
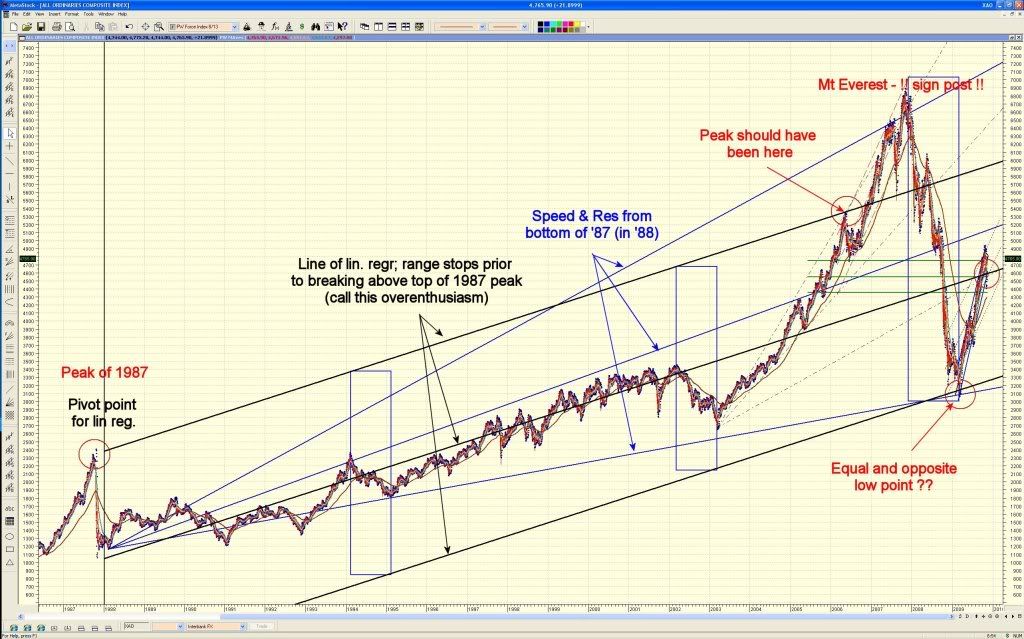
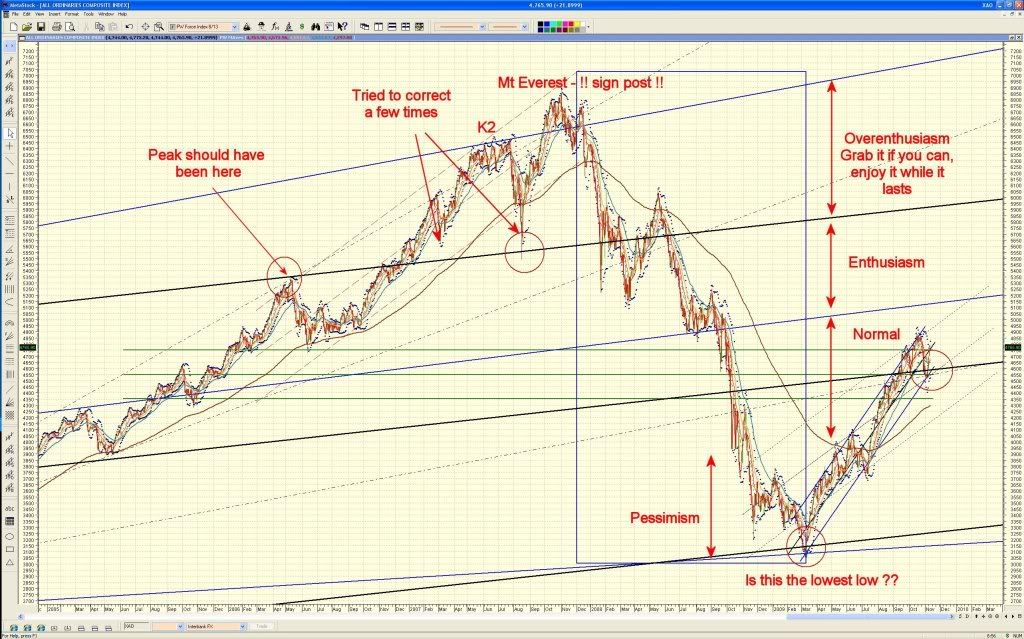
If you subscribe to the theory that the market can itself get overenthusiastic, or be injected with way too much liquidity, then signs were posted during the Mt Everest period of 2007. Like wise it can get too pessimistic. These zones of reaction and overreaction occur either side of a median average that is the linear regression.
i.e. in 2007, the market was due to get positively belted.
Long term time span from the 'crash' of 1987 below. Gann tells you (as should your common sense) that longer time frame trends override shorter time frames.
I'm a big fan of using linear regression (average) over longer time frames. See below - this tells you the peak of 1987 projected 'what should have been' the peak of 2006.
Several signs throughout 2007 were trying to tell us we HAD overstepped the mark, and were positively overenthused. This can only come from an injection of liquidity that 'didn't care how much it cost'. this liquidity went in in 2007, and came out in 2008.
You can see it comes out in much worst shape than it goes in with. then the period of underenthusiasm, or overpessimism. ironically, IMO big players would have waited until the equal and opposite to start supporting the lower price range and hence begin to get back into the market with a rush. Something to keep in mind the next time it happens.
Are we fair valued today? you bet we are. and trading around these values is healthy. short term though, +/- 300 pts is nothing on the long term scheme of things. will we stay hear? another $64 question.
The market rate of ascent must surely be in for a checkup right about now. if not, I'll enjoy the ride, but be very wary of market overenthusiasm, as the indicators are telling us to be.
Again, it comes down to the fundamental aspect of how much liquidity is in the market that 'might' move out when it does. then look at 'where' it moves out from.
Perhaps look for a peak of 5150 before a correction ... and a low below 3200 if she goes down again. the equal opposite low to Mt Everest is around 2000 - using K2 it's 2300. It tells you expontential growth periods won't outgrow the long term average growth.
Hope this helps. Cheers
pw
XAO long term 1987 to 2009
XAO zoomed in
in case doom and gloom sets in and the second lowest low is yet to come, at least now you might know why and what to look for.
From the above, it reinforces that charting for the sake of charting without understanding the fundamentals behind what the trend is indicating, is a false sense of security. at least make an attempt to understand WHY the trend is occuring, and be confident that if something looks too good to be true, it probably is, and enjoy it while it lasts.
Elliot waves etc might be fabulous, but market trends only ever indicate market intent. it the market actions that determine the trends, and not the other way around.
If this goes further south, it's because we haven't yet corrected from the gross levels of 2007's Mt Everest that's all. Only now you have a target range that might be more realistic.
rgds.
Add to My Watchlist
What is My Watchlist?


