https://scholar.harvard.edu/quant-dev/cup-and-handle-pattern-detection-algorithm
Cup and Handle pattern detection algorithmLast year I spent several weeks working with my friend from Princeton to implement Cup and Handle pattern scanner. I would now like to share some of our key findings during the development of the algorithm.
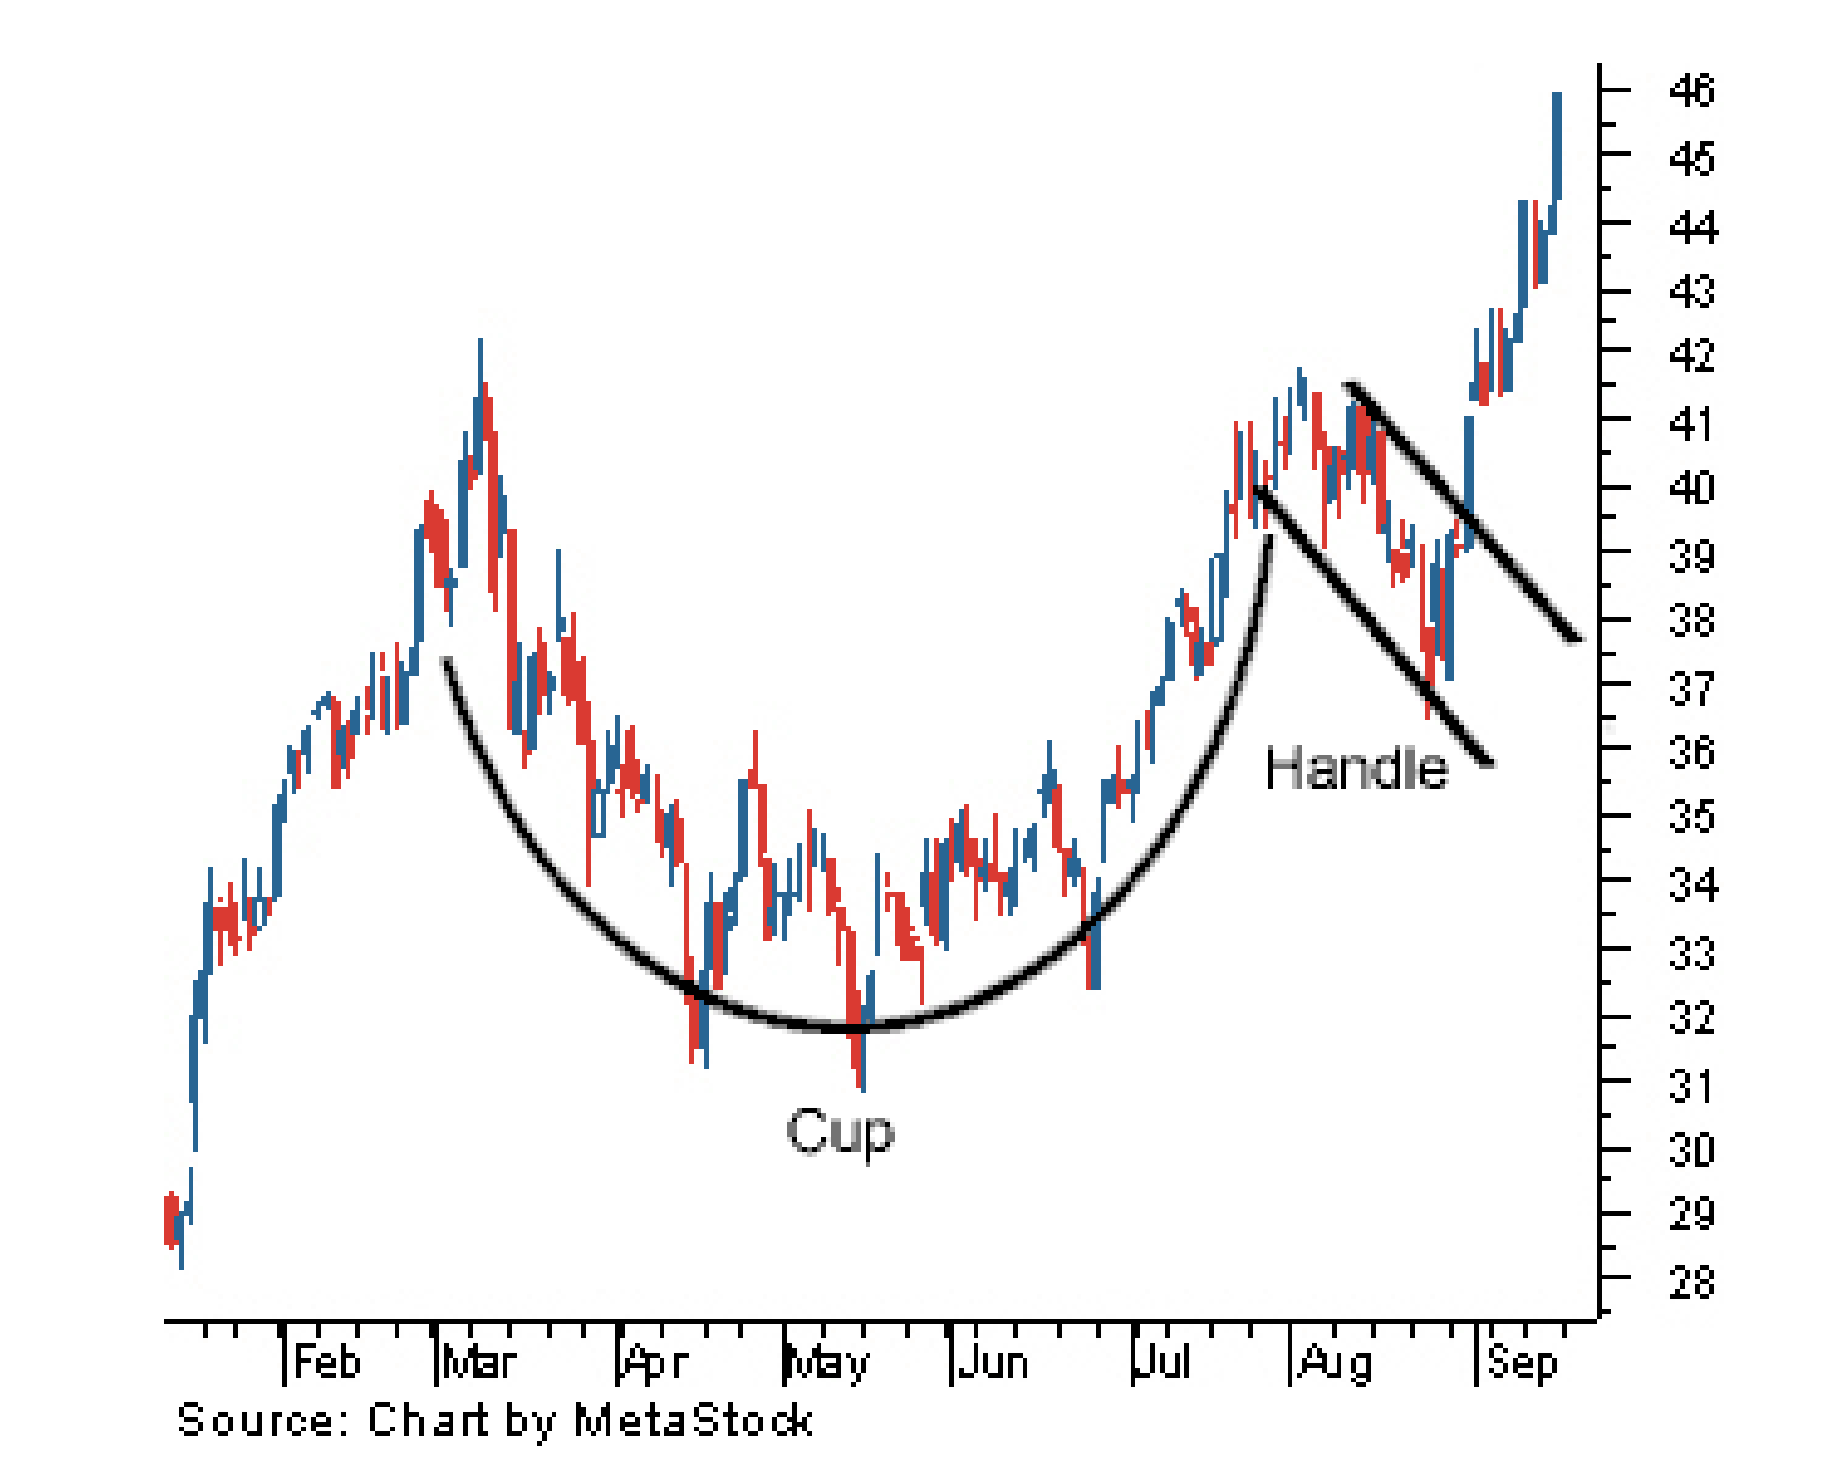
The Cup and Handle pattern
A Cup and Handle pattern is a bullish continuation pattern that resembles a teacup on a candle chart. The cup part of the pattern is where the price gradually changes its direction from bearish to bullish, intuitively speaking, the investors are gaining hope in the performance of the security. The handle part is when the price pullback slightly before roars higher and continues the previous trend. The Cup and Handle pattern can take between 30 to 50 candles to form on any given time resolution.
Finding Cup and Handle
In financial literature, there are 2 major methods to algorithmicaly identify chart pattern:
1. Finding local max and min points from the OHLC data and define the pattern via these points.
- The main idea of this method is to find the local extrema from price data, then define pattern via condtion of these local extrema.
- To indentify peaks and troughs, we can use a smoothing function like moving average.
2. Using template matching
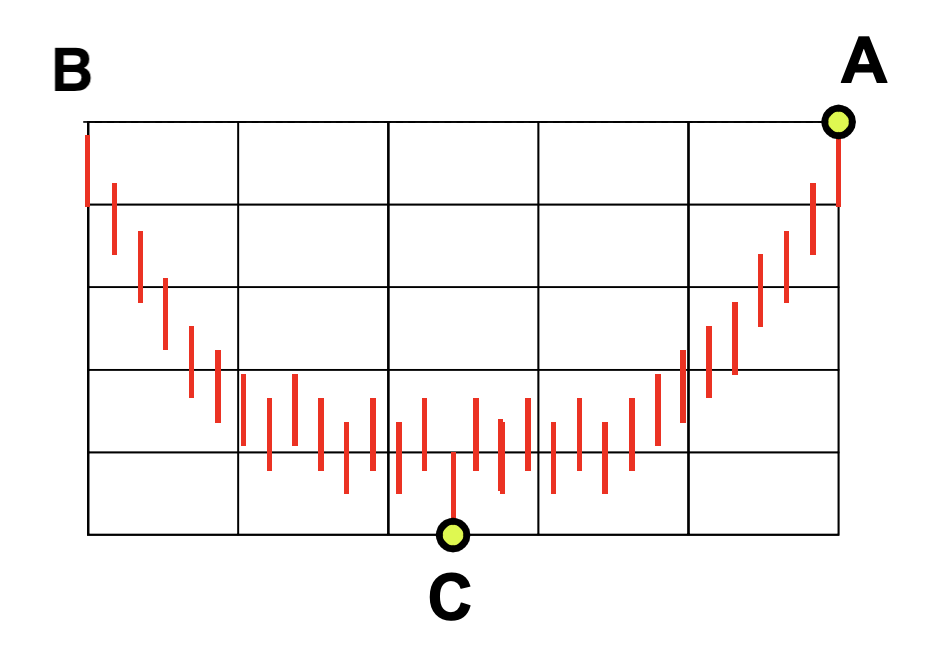
Template matching is an idea borrowed from computer vision to find a small part of the image which matches a template image. In chart pattern recognition, we use the template matrix and slice it over a time range to find the desired pattern. Here is how it works to find the Cup and Handle
Starting from point A, go back in time to find point B where priceB is around priceA. Let C is the lowest price in range (B, A), we then superimpose a 5x5 matrix using A, B, and C as milestones.
We then use apply our conditions within a 5x5 matrix. We can be more conservative or relax our condition here, feel free to explore the idea.
Condtion: there is no closing price inside the yellow cells AND no high price inside the orange cells.
This algorithm works extremely well when backtesting using forex and stock data provided byFinnhub stock api. The accuracy rate for cup and handle pattern for forex and stock on Daily timeframe are 65% and 68% respectively. We automated this backtesting process using the pattern recognition API of HarmonicPattern.com harmonic scanner.
D W H1 Stock 68% 66% 52% Forex 65% 64% 49% Reference:
- Algorithmic Identification of Chart Patterns
- Data used for backtesting provided byFinnhub stock API
https://scholar.harvard.edu/quant-dev/cup-and-handle-pattern-dete...


Add MNS (ASX) to my watchlist
 (20min delay) (20min delay)
|
|||||
|
Last
4.2¢ |
Change
0.000(0.00%) |
Mkt cap ! $50.37M | |||
| Open | High | Low | Value | Volume |
| 0.0¢ | 0.0¢ | 0.0¢ | $0 | 0 |
| MNS (ASX) Chart |
Day chart unavailable