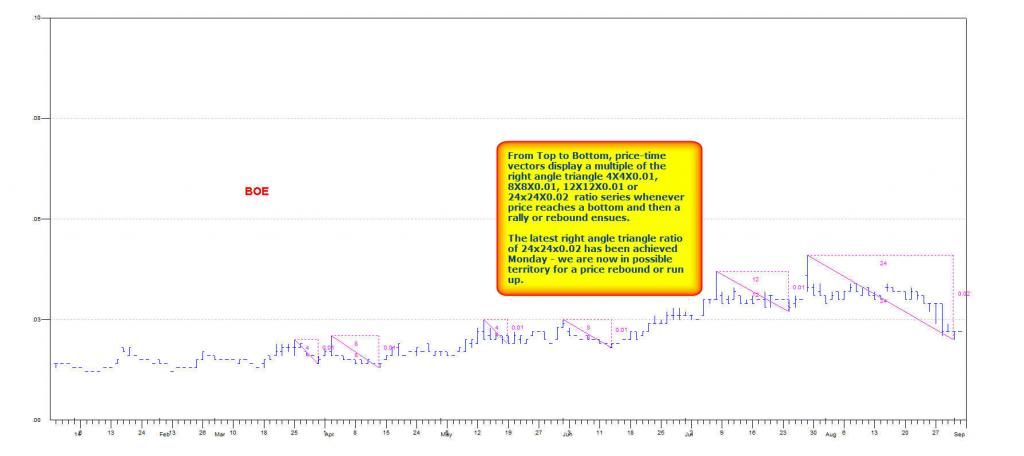
The stock BOE displays a peculiar geometric proportion of a triangle formed by computing the price-time vector by drawing the triangle formed by the peak price of a price range to the bottom of the price range. Whenever the geometric proportion is reached, the downtrend is terminated, and a price rebound or rally begins.
The goemetric proportions for BOE on a squared chart takes the form of 4x4x0.01, 8x8x0.01, 12x12x0.01 or 24x24x0.02 which are easily recognisable. As can be seen from the chart, the moment this price-time vector is achieved, each time the price of BOE has started to rebound or move into uptrend. We have sighted the completion of the price-time vector 24x24x0.02 on Monday. What are the possibilities of a ride soon?
The stock BOE displays a peculiar geometric proportion of a...


Add BOE (ASX) to my watchlist
 (20min delay) (20min delay)
|
|||||
|
Last
$3.67 |
Change
-0.070(1.87%) |
Mkt cap ! $1.501B | |||
| Open | High | Low | Value | Volume |
| $3.73 | $3.80 | $3.67 | $7.283M | 1.959M |
Buyers (Bids)
| No. | Vol. | Price($) |
|---|---|---|
| 6 | 17997 | $3.66 |
Sellers (Offers)
| Price($) | Vol. | No. |
|---|---|---|
| $3.67 | 13533 | 3 |
View Market Depth
| Last trade - 16.10pm 23/07/2024 (20 minute delay) ? |
| BOE (ASX) Chart |