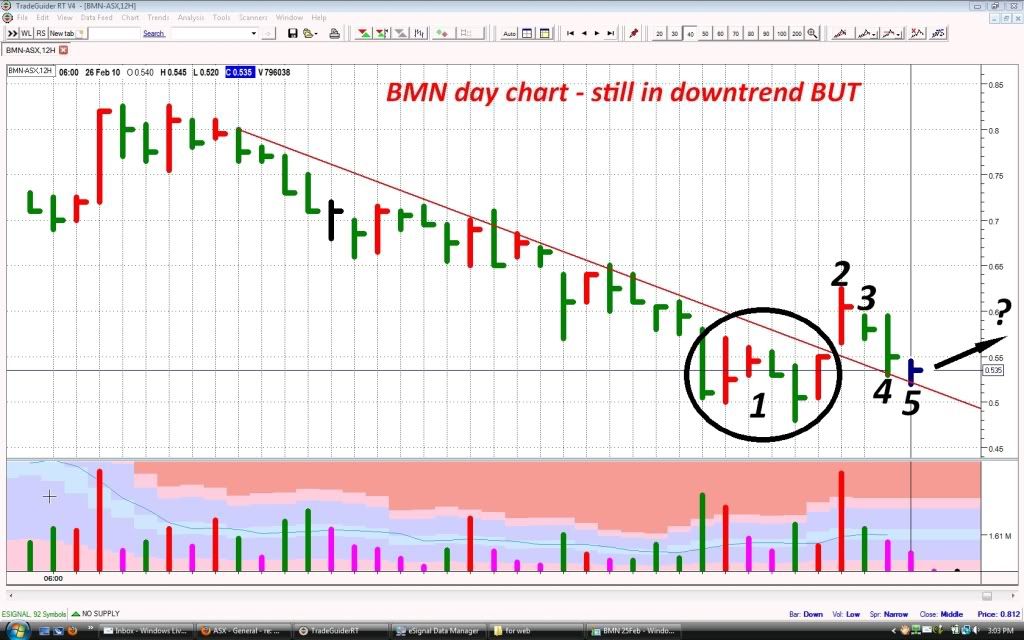
By the end of this week we should have a better picture of which way BMN is heading in the ST. Please refer to the chart numbers.
1. This is the area the week before last when things started stirring and by that weeks end we could feel a possible change in direction. Refer to some of my previous posts for a clearer analysis of that week.
2. This bar is last Tuesday, a day which BMN jumped clear of the downward trendline. It also gapped up which is a sign of potential weakness, also on very big volume and not closing on the top, which is another sign of potential weakness.
3. This is a narrow spread day on high volume, normally this is a potential sign of strength, but maybe it was too close to all that weakness ( selling ) the previous day.
4. This is wide spread day on low volume, still reacting to the prior weakness, really a nothing day.
5. Last bar is Friday and is narrow spread and low volume, indicating a lack of selling at the time. The lowest volume bar for the week also and is in the same area from the week prior were it was finding strength.
Now an aggressive trader in the ST would maybe buy on the close of this bar or wait for entry on a breakup of this day. I would myself wait a couple of days for this to go up and then enter on the next low volume down day, just to minimise any risk of downside. lol all holders
- Forums
- ASX - By Stock
- maybe new direction
BMN
bannerman energy ltd
Add to My Watchlist
1.16%
 !
$3.50
By the end of this week we should have a better picture of which...
Featured News
Add to My Watchlist
What is My Watchlist?
A personalised tool to help users track selected stocks. Delivering real-time notifications on price updates, announcements, and performance stats on each to help make informed investment decisions.
 (20min delay) (20min delay)
|
|||||
|
Last
$3.50 |
Change
0.040(1.16%) |
Mkt cap ! $718.9M | |||
| Open | High | Low | Value | Volume |
| $3.37 | $3.56 | $3.37 | $14.32M | 4.085M |
Buyers (Bids)
| No. | Vol. | Price($) |
|---|---|---|
| 1 | 500 | $3.49 |
Sellers (Offers)
| Price($) | Vol. | No. |
|---|---|---|
| $3.54 | 1000 | 1 |
View Market Depth
| No. | Vol. | Price($) |
|---|---|---|
| 1 | 500 | 3.490 |
| 1 | 160 | 3.400 |
| 1 | 1474 | 3.370 |
| 1 | 6060 | 3.300 |
| 1 | 481 | 3.290 |
| Price($) | Vol. | No. |
|---|---|---|
| 3.630 | 8771 | 1 |
| 3.640 | 1123 | 3 |
| 3.650 | 3000 | 1 |
| 3.690 | 2800 | 1 |
| 3.740 | 2800 | 1 |
| Last trade - 16.10pm 19/09/2025 (20 minute delay) ? |
Featured News
| BMN (ASX) Chart |


