Aaarrgghhh. Sensationalist non researched clickbait. Cherry picked statistics, empty of any real content. The joys of Yahoo finance. I swear it's a chat GPT article
The only positive is the exposure and the headline will probably put us on a few watch lists...
There is a link in the bottom to email their editorial team if you have concerns with the accuracy of their post..
I've sent off an email but I probably recommend if you read this, And would like to potentially inform them of their oversights.
You may want to mail them as well
finance.yahoo.com/news/investors-imugene-asx-imu-made-005952058.html
in case HC censors the link.
https://tinyurl.com/j3nrazd3
cheers
Apo!Investors in Imugene (ASX:IMU) have made a enviable return of 584% over the past three years
Simply Wall StSun, 26 March 2023 at 8:59 am AWST·3-min readIt hasn't been the best quarter for Imugene Limited (ASX:IMU) shareholders, since the share price has fallen 10% in that time. But that doesn't change the fact that the returns over the last three years have been spectacular. Over that time, we've been excited to watch the share price climb an impressive 584%. So you might argue that the recent reduction in the share price is unremarkable in light of the longer term performance. The thing to consider is whether there is still too much elation around the company's prospects. It really delights us to see such great share price performance for investors.
So let's assess the underlying fundamentals over the last 3 years and see if they've moved in lock-step with shareholder returns.
View our latest analysis for Imugene
Ad: 0:050:15Imugene wasn't profitable in the last twelve months, it is unlikely we'll see a strong correlation between its share price and its earnings per share (EPS). Arguably revenue is our next best option. When a company doesn't make profits, we'd generally expect to see good revenue growth. As you can imagine, fast revenue growth, when maintained, often leads to fast profit growth.
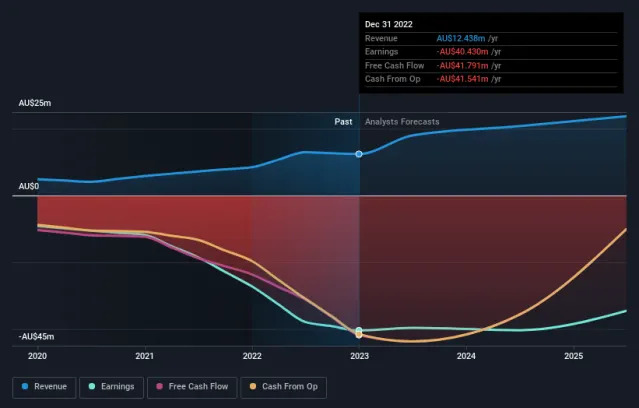
Imugene's revenue trended up 40% each year over three years. That's much better than most loss-making companies. And it's not just the revenue that is taking off. The share price is up 90% per year in that time. It's always tempting to take profits after a share price gain like that, but high-growth companies like Imugene can sometimes sustain strong growth for many years. So we'd recommend you take a closer look at this one, or even put it on your watchlist.
You can see below how earnings and revenue have changed over time (discover the exact values by clicking on the image).
earnings-and-revenue-growthIf you are thinking of buying or selling Imugene stock, you should check out this FREE detailed report on its balance sheet.
A Different Perspective
We regret to report that Imugene shareholders are down 52% for the year. Unfortunately, that's worse than the broader market decline of 3.6%. Having said that, it's inevitable that some stocks will be oversold in a falling market. The key is to keep your eyes on the fundamental developments. On the bright side, long term shareholders have made money, with a gain of 32% per year over half a decade. If the fundamental data continues to indicate long term sustainable growth, the current sell-off could be an opportunity worth considering. While it is well worth considering the different impacts that market conditions can have on the share price, there are other factors that are even more important. Consider for instance, the ever-present spectre of investment risk. We've identified 2 warning signs with Imugene , and understanding them should be part of your investment process.
Aaarrgghhh. Sensationalist non researched clickbait. Cherry...


Add IMU (ASX) to my watchlist
 (20min delay) (20min delay)
|
|||||
|
Last
5.7¢ |
Change
0.001(1.79%) |
Mkt cap ! $418.9M | |||
| Open | High | Low | Value | Volume |
| 5.6¢ | 5.7¢ | 5.4¢ | $461.9K | 8.347M |
Buyers (Bids)
| No. | Vol. | Price($) |
|---|---|---|
| 7 | 1082545 | 5.5¢ |
Sellers (Offers)
| Price($) | Vol. | No. |
|---|---|---|
| 5.7¢ | 603058 | 6 |
View Market Depth
| Last trade - 16.10pm 19/07/2024 (20 minute delay) ? |
| IMU (ASX) Chart |