Just stumbled upon this thrad and I like the idea of it. Seems a bit inactive but that's not necessarily a bad thing. Continuing Thanky's idea of the XJO (ASX200). Drew a graph of it on my charting software a while ago but that chart is way too messy so I'll post a simple graph.
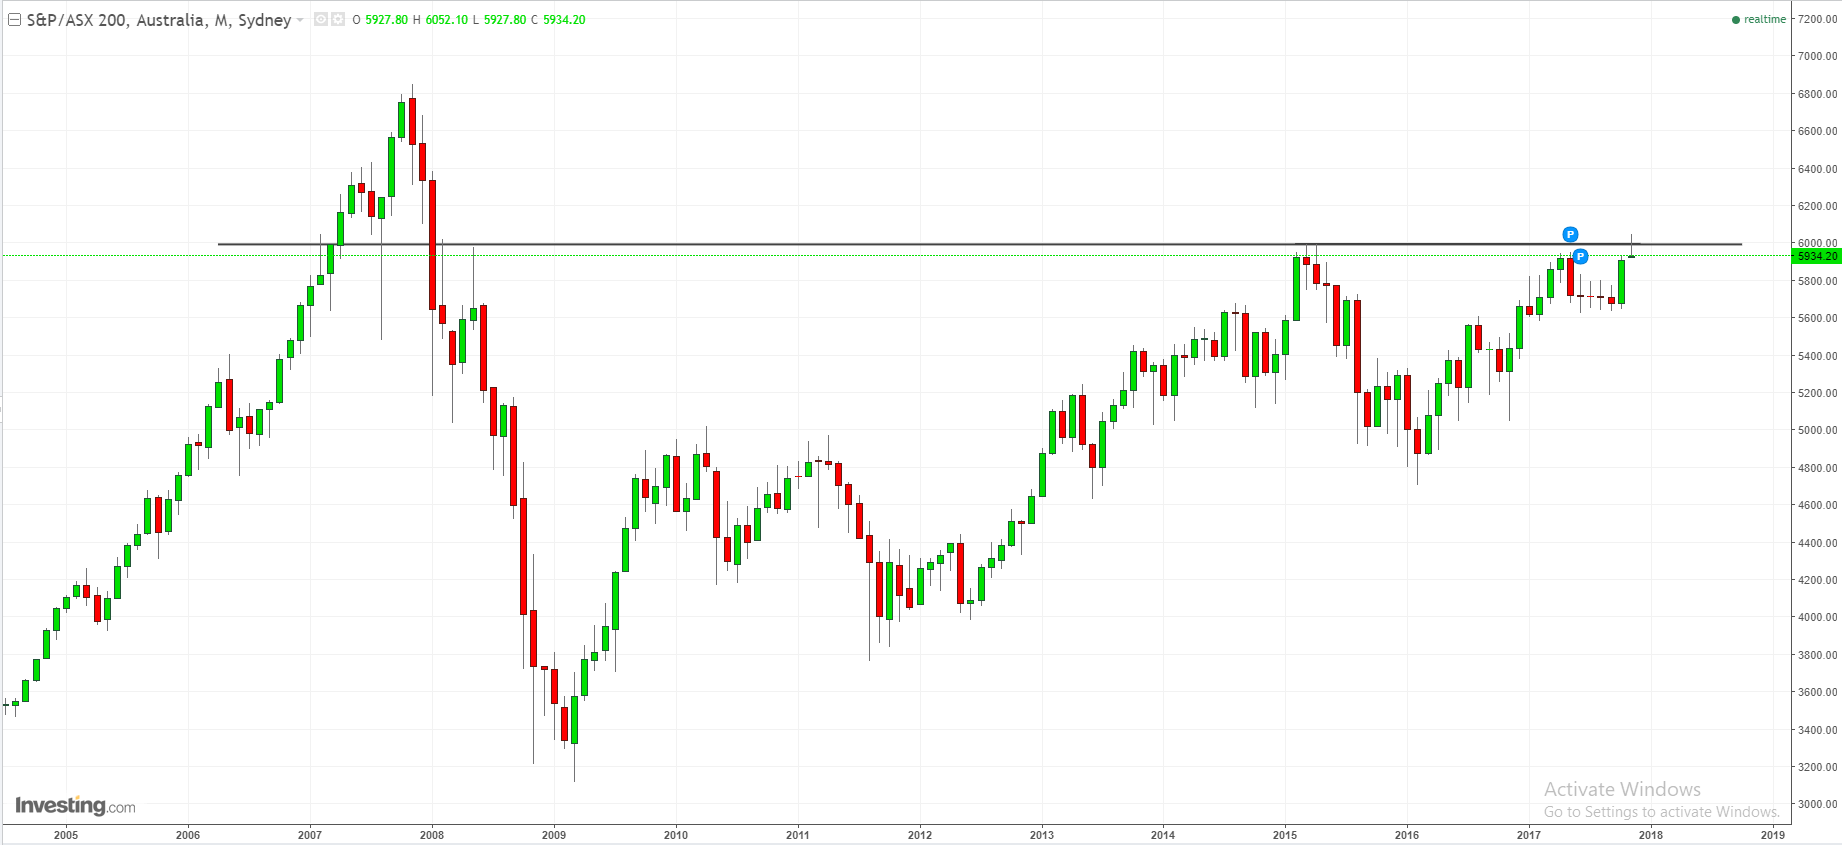
This is a monthly chart of the XJO, with the main level being 6000. A level breached last week which was also the high in early 2015. Now this could be a double top, however if it does dip down and build enough strength to break upwards there should be relatively clear skies up towards the 6800 level.
A good trade would be waiting for a breach of last week's high and riding it up to the pre-GFC level of 6800 in 2007. The US markets are well above their pre-GFC highs so Australia might have some catching up to do.
The only worry is lower commodity prices than the ones 10 years ago and Australia being so dependent on mining. Also the US markets do seem overbought so a correction might be likely. Keen to hear your thoughts.