BULLISH harami candle pattern formed at 1950 - 2150 last 4 days
yesterday a 2156 to 2018 lower red body
today a 2015 - 2092 green body
the prior red candle is engulfing todays green harami
this follows from the bullish harami from tuesday to fridays candle split with mondays lower dragonfly doji with LONG 120c tail
this is all happening at 1950 - 2150 with the dragonfly tail at 1960 rejected and tuesdays tail under 2090 also rejected
todays reversal candle has made the short term TA go green again
Buyers are starting to take control.
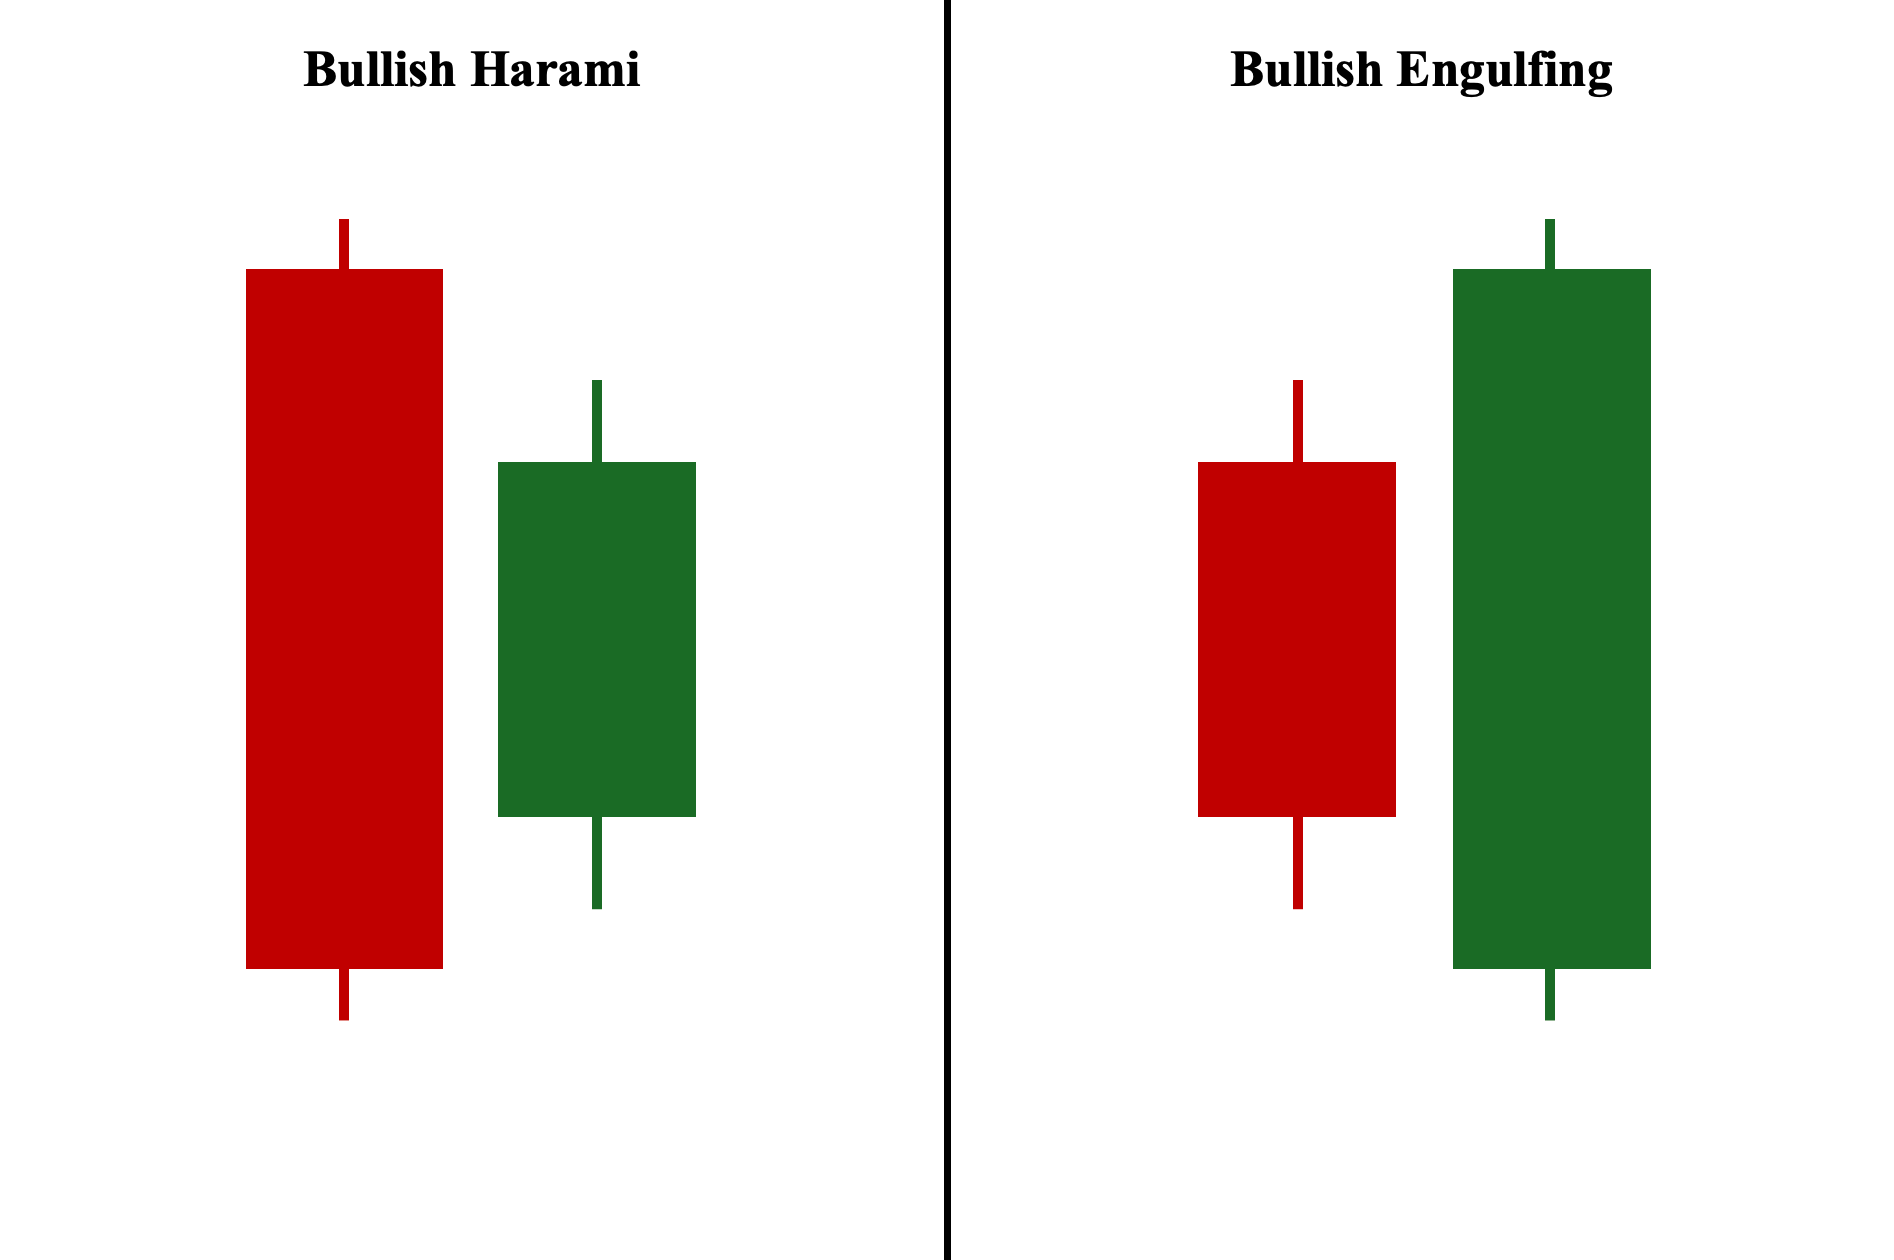
"A bullish harami is a two-candle candlestick pattern that signals a potential reversal of a downtrend in the market. The first candle in the pattern is a long, bearish (red) candle, indicating strong selling pressure. The second candle is a smaller, bullish (green) candle, whose body is completely contained within the body of the first candle. This suggests that the downward momentum is weakening and buyers may be starting to take control.
Here's a more detailed explanation:
Downtrend:
The bullish harami typically appears at the end of a downtrend, where prices have been consistently falling. (eg at monthly lows)
First Candle:
The first candle is a long bearish candle, signifying that sellers are in control and pushing prices lower.
Second Candle:
The second candle is a smaller bullish candle, indicating that buyers are starting to step in, but their influence is not yet strong enough to completely reverse the trend.
Body Enclosure:
The key characteristic is that the second candle's body is completely contained within the body of the first candle.
Potential Reversal:
The bullish harami suggests that the downtrend may be ending and that a reversal to the upside is possible.
Confirmation:
It's important to look for confirmation of the reversal, such as a strong bullish candle or increased trading volume on the following days.
In essence, the bullish harami pattern indicates a potential shift in market sentiment from bearish to bullish, suggesting that buyers may soon start dominating the market."
close above 2050 bullish, they cant stop the green candle print.
setting up the green floor marker for tomorrow looks like.
A personalised tool to help users track selected stocks. Delivering real-time notifications on price updates, announcements, and performance stats on each to help make informed investment decisions.


 (20min delay)