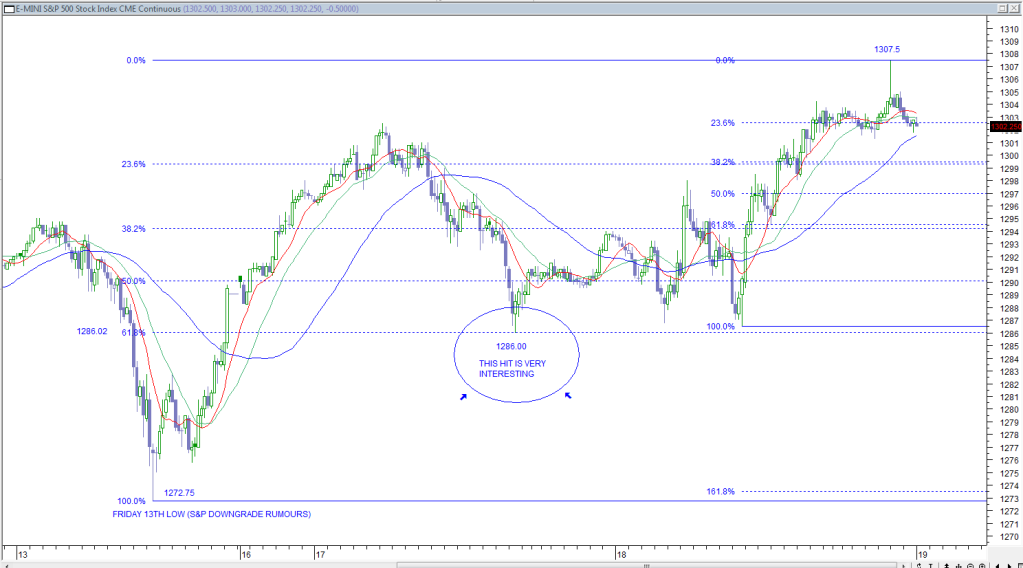
Here is another chart of the S&P futures (15 min) going into the low of last Friday morning (NY time) and up into the spike high a few hours ago. The larger fib setting has a very interesting hit at the 61.8 level right in the middle of the chart. Could the market behave that well? Note the 2 fibs lined up at the 1299.5 level. That would be obvious support for a bounce off that level about 2 points below now.
- Forums
- ASX - By Stock
- XJO
- mittas hopping onto the dance floor thursday
mittas hopping onto the dance floor thursday, page-52
Featured News
Add XJO (ASX) to my watchlist
 (20min delay) (20min delay)
|
|||||
|
Last
8,224.0 |
Change
30.600(0.37%) |
Mkt cap ! n/a | |||
| Open | High | Low |
| 8,193.4 | 8,239.4 | 8,193.4 |
Featured News
| XJO (ASX) Chart |


