here is something for lovers of a good old fibonacci time division. If indeed the recent top of the DJIA proves to be a major top then the flash crash of last May will mark the 61.8%/38.2% division of the bull run between the march 2009 low and the recent top. Perhaps in one sense the flash crash is not that significant in as much as it was not a major low defining the end of a trend....but in another sense it does remain very significant. It does stand as the biggest one day points drop of all time and the recovery was just as spectacular. But also it remains an enigma. Debate raged, inquiries were held but still I don't think I have seen a satisfactory explanation for its occurrence.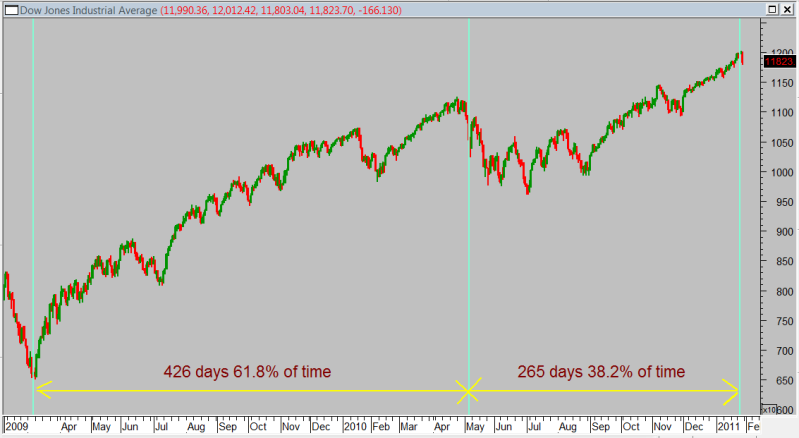
here is something for lovers of a good old fibonacci time...


Add XJO (ASX) to my watchlist
 (20min delay) (20min delay)
|
|||||
|
Last
8,099.9 |
Change
24.200(0.30%) |
Mkt cap ! n/a | |||
| Open | High | Low |
| 8,075.7 | 8,143.6 | 8,075.7 |
| XJO (ASX) Chart |