SanFelipe
"Thanks Muzza, however why wouldnt you have the T/L touching the lowest points, in which case the latest price action would be below the T/L. ? "
The reason is not that easy. A trendline to be "confirmed trendline" should touch at least 3 points, so these are the first 3 points in the chart at March 03, April 04 and March 05. This sets the position of the trendline. The market also came back to the trendline in Nov 05.
The other points on the charts then reflect an "oversold position" in the whole market. Thus I find it best not re-draw the trendline to "try to make it fit", but watch the action around the trendline. The market fell below the T/L in June 06 and again in Feb/March of 07, but rebounding reasonable quickly. This highlighted the market still had buying strength.
This current fall has taken the market well below this T/L and we need to wait until we get a confirmation that this T/L has indeed been broken and to what extent. How long will this be...I'd suggest 2 weeks, but any more reasonable falls and I think you could reasonably say that the T/L has now failed.
The current breach of the T/L is by the worse currently at 204 pts below the T/L, as shown.
Support on the FTSE is at 6135, then at 5999.
I have provided a zoomed in FTSE chart for reference.
Cheers
Muzz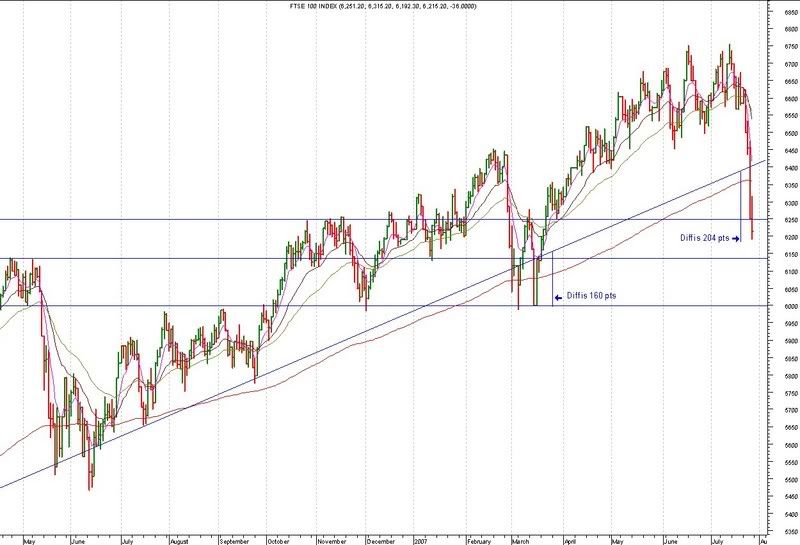
monday madness, page-55


Add XJO (ASX) to my watchlist
 (20min delay) (20min delay)
|
|||||
|
Last
7,954.1 |
Change
22.400(0.28%) |
Mkt cap ! n/a | |||
| Open | High | Low |
| 7,931.7 | 7,954.5 | 7,931.7 |
| XJO (ASX) Chart |