Couple things just for intrest ,the SPI and emini SP.
First of all is the reference points
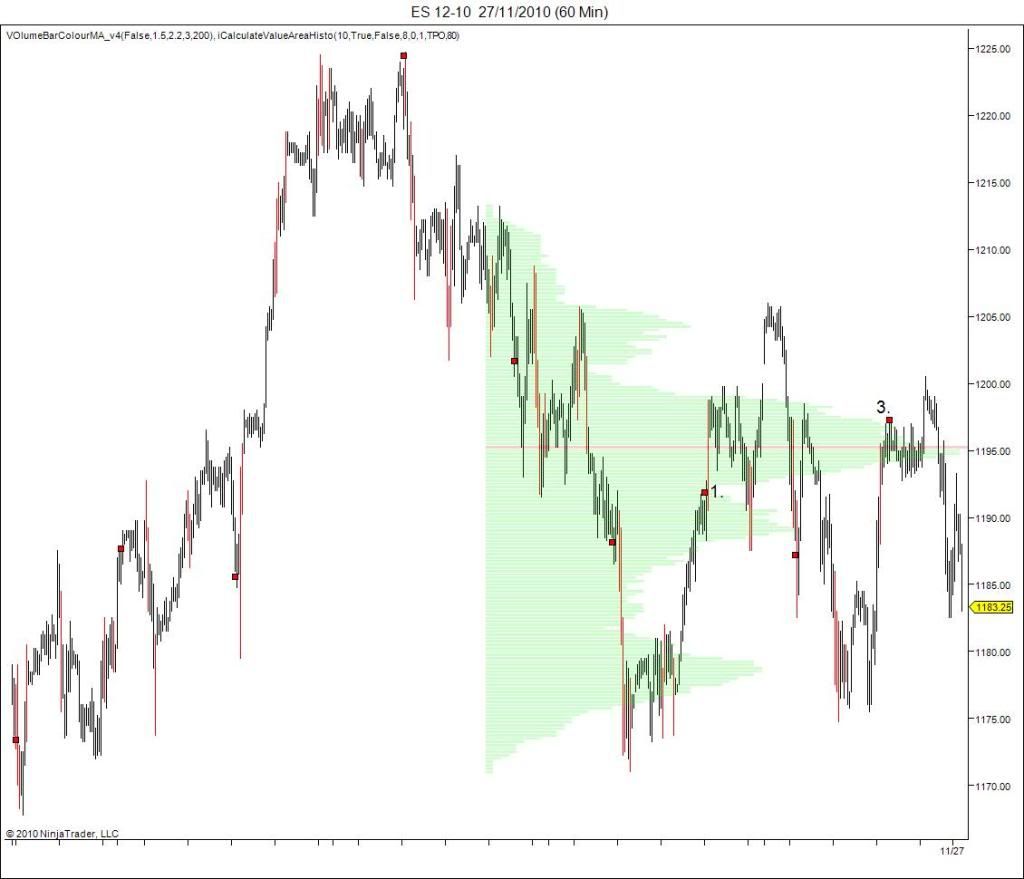
( the relationship between ref 1. and 3.)..
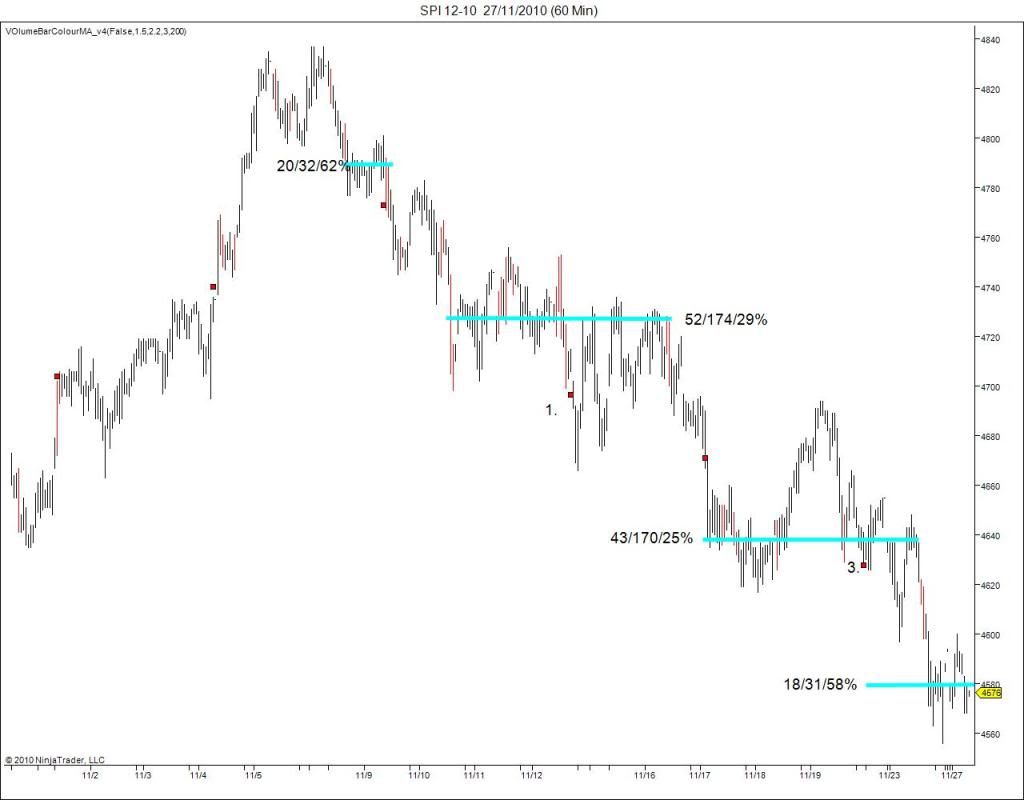
the SPI is clearly bearish , yet the leader the SP is clearly horozontal..HMMM , why is it so ?? our dollar lost aprox 3% last week that could explain it..I'm no economist or expert so I don't try to figure these things out ..but perhaps our little market is a bit over sold..however the chart is not telling me to rush in to by and hold ..I'm still looking to sell any strength.
Just for intrest I marketd the relationships between the vertical and horozontal on the way down.The main trend has been down ..and the reference points reflect that ..however along the way it settled into a series of trading ranges..
the first on shows that in that little range the market used up 32 30 min time slots , of those 20 or 62% of those slots traded at the most traded price for the range.Currently we have 18 of 31 at 4580 ..or 58% ..might be enough to shut off the down side for now...we reconnect with the upside above 4622.good luck.

Add to My Watchlist
What is My Watchlist?


