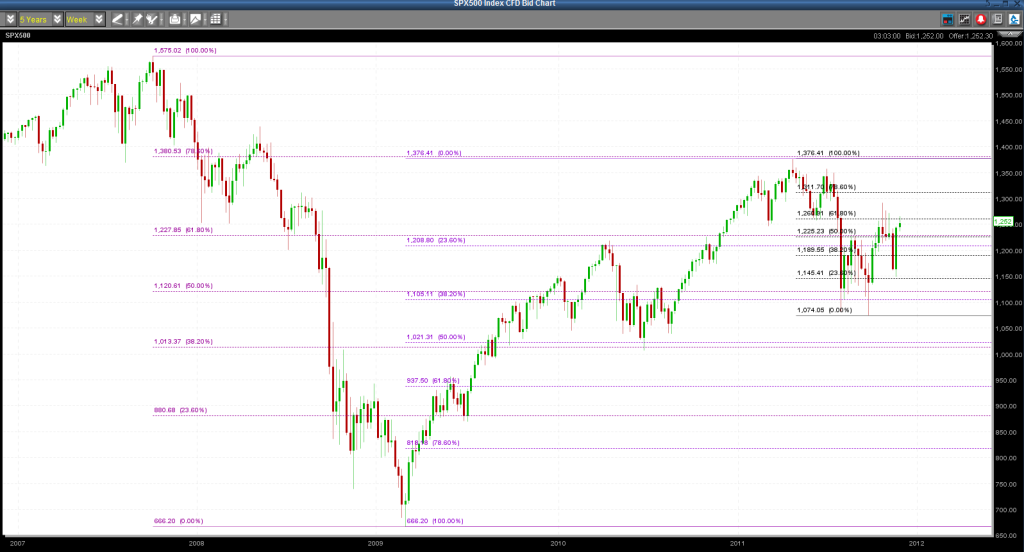
Here is the weekly SPX CFD chart compliments of CMC showing the big bear of 07/08 and the big bull of 09/11. Now what is going on with this move down? Is it a new bear? Is it a consolidation of the bull, like in mid 2010? Or looked at another way, was it a short bear that has run it's course and now a new bull is beginning?
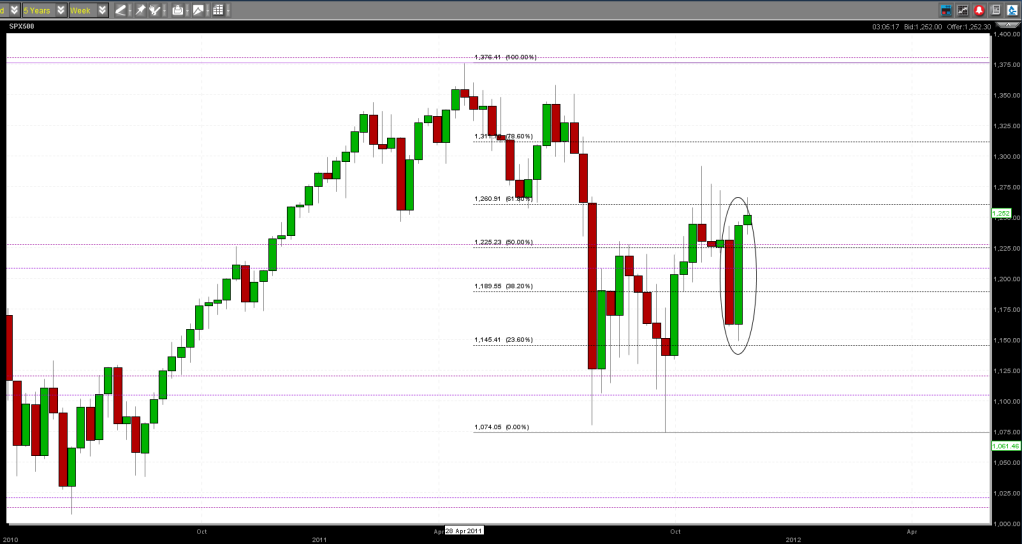
Over the weekend, I offered some analysis and comments on the workings of outside up bars (or rising enveloping candles, which are the same thing). Here is a close up of the same chart from the 2010 low, with this year's top, the July/August falls and more recent rises and falls. Have a look at last week’s candle. Perfect for further lift in the coming weeks. Like the October month's similar candle, you wouldn't expect the following week after a candle like that to be a big down week. That candle should offer support throughout the month of December.
Like Volt and all other CMC customers, I have to put up with a whacked out weekly open and close time because CMC open and close times are fixed to their server. Nonetheless, the charts should still be useful.
- Forums
- ASX - By Stock
- XJO
- moolamanic's - holdin' 'n' grinnin' - tuesday
moolamanic's - holdin' 'n' grinnin' - tuesday, page-60
-
- There are more pages in this discussion • 112 more messages in this thread...
This thread is closed.
You may not reply to this discussion at this time.
You’re viewing a single post only. To view the entire thread just sign in or Join Now (FREE)
Featured News
Add XJO (ASX) to my watchlist
 (20min delay) (20min delay)
|
|||||
|
Last
8,295.1 |
Change
68.800(0.84%) |
Mkt cap ! n/a | |||
| Open | High | Low |
| 8,226.3 | 8,319.4 | 8,226.3 |
Featured News
| XJO (ASX) Chart |
The Watchlist
EQN
EQUINOX RESOURCES LIMITED.
Zac Komur, MD & CEO
Zac Komur
MD & CEO
SPONSORED BY The Market Online


