Emini s&p 500 futures contract daily. Note the VERTICLE lines as the are placed at the MACD crosses. You can see how the market played out after the prior 2 crosses This is also the 4th go at the 200 sma so that should carry the probability of a move through. The patterns in the intraday charts for this contact and the S&P500 index seem to be similar to those of the consolidations mid point of the October rally. Further, the 2 prior resistance lines caused by the triangle should not offer support (should).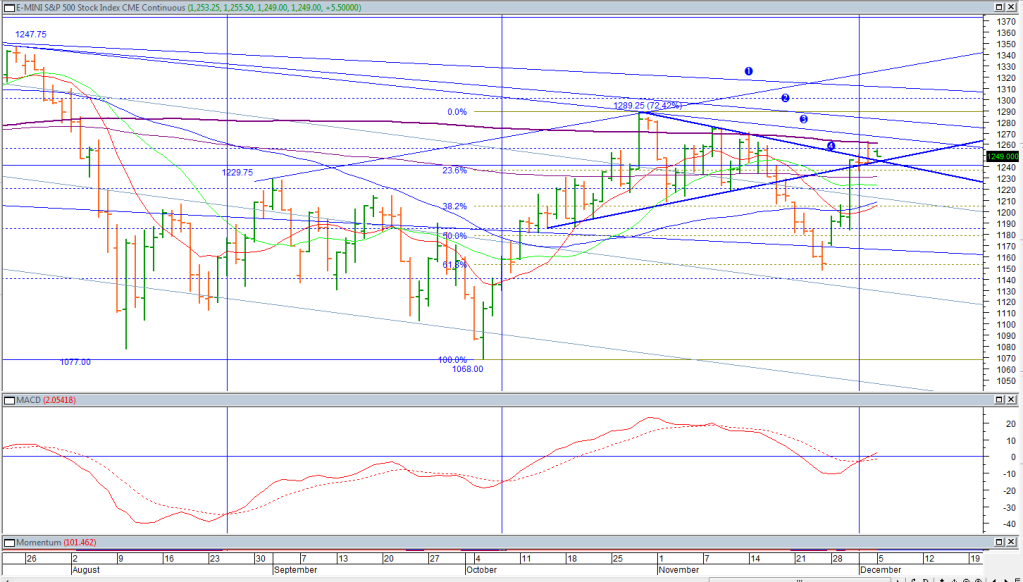
Emini s&p 500 futures contract daily. Note the VERTICLE lines as...


Add XJO (ASX) to my watchlist
 (20min delay) (20min delay)
|
|||||
|
Last
8,150.0 |
Change
-55.200(0.67%) |
Mkt cap ! n/a | |||
| Open | High | Low |
| 8,205.2 | 8,205.2 | 8,107.6 |
| XJO (ASX) Chart |