1s and 2s
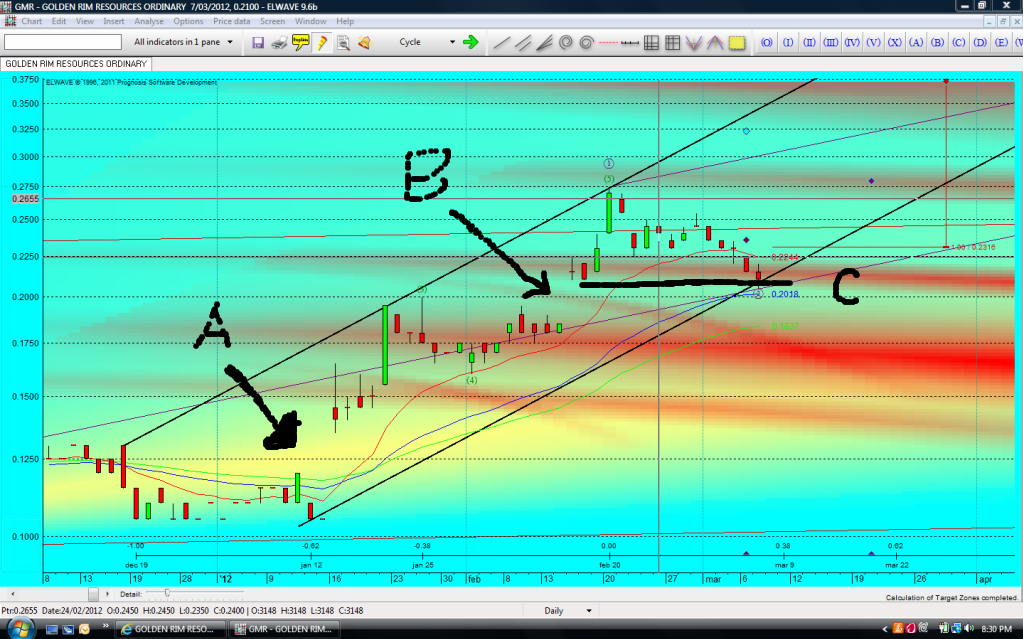
The gaps that appears in the charts above are where opening price gaps up .That is it opens higher than the previous close and close higher than the previous close.
"A" on the chart shows The GAP in January signalled a whole new up trend for GMR .
Gap "B" -The gap we were discussing today was from the trading on 15/02 this year .
To have this gap "close" it would have to in the next few weeks see the share price over that period creep down to "fill the gap" by trading down to 18.5c .
In my response to Ultra today I incorrectly said that the gap may have closed @ 21cents (ish) but instead my thoughts really should have read that it was reaching an area of "resistance" @ "C" which in fact is the low of the B gap. I apologise Ultra for this.
And like Hector has said the market didnt know where to go with this ann because of the where the ann was made in the chart pattern.
Gap A is "breakaway gap" and if gap B performs the way I think it will it is also one.(very powerful)
Also today the stock hit a longterm trendline
( shown on chart) which also reinforces that it is at a resistance area .
I will stick my neck out and say i dont think either of the gaps will close EVER, and this is why I purchased more today at 21cents .( 1s and 2s all the charting terminology can be Goggled)
We will all wait and see
- Forums
- ASX - By Stock
- more drill results out
1s and 2s The gaps that appears in the charts above are where...
-
- There are more pages in this discussion • 3 more messages in this thread...
You’re viewing a single post only. To view the entire thread just sign in or Join Now (FREE)
Featured News
Add AS1 (ASX) to my watchlist
 (20min delay) (20min delay)
|
|||||
|
Last
1.2¢ |
Change
0.001(9.09%) |
Mkt cap ! $10.58M | |||
| Open | High | Low | Value | Volume |
| 1.2¢ | 1.2¢ | 1.2¢ | $600 | 50K |
Buyers (Bids)
| No. | Vol. | Price($) |
|---|---|---|
| 1 | 1000000 | 1.1¢ |
Sellers (Offers)
| Price($) | Vol. | No. |
|---|---|---|
| 1.2¢ | 115860 | 2 |
View Market Depth
| No. | Vol. | Price($) |
|---|---|---|
| 1 | 1000000 | 0.011 |
| 1 | 3000000 | 0.010 |
| 4 | 798729 | 0.009 |
| 7 | 1225052 | 0.008 |
| 6 | 2523375 | 0.007 |
| Price($) | Vol. | No. |
|---|---|---|
| 0.012 | 115860 | 2 |
| 0.013 | 197186 | 2 |
| 0.014 | 145000 | 3 |
| 0.015 | 202629 | 2 |
| 0.020 | 398000 | 1 |
| Last trade - 12.28pm 16/08/2024 (20 minute delay) ? |
Featured News
| AS1 (ASX) Chart |


