More prognostications... (For what they are worth)
If this is a dead cat bounce we will resume slide tonight till the 24th July then end of Aug high and october lows.
or we dilly-dally around till end of July then resume going down till sept-oct
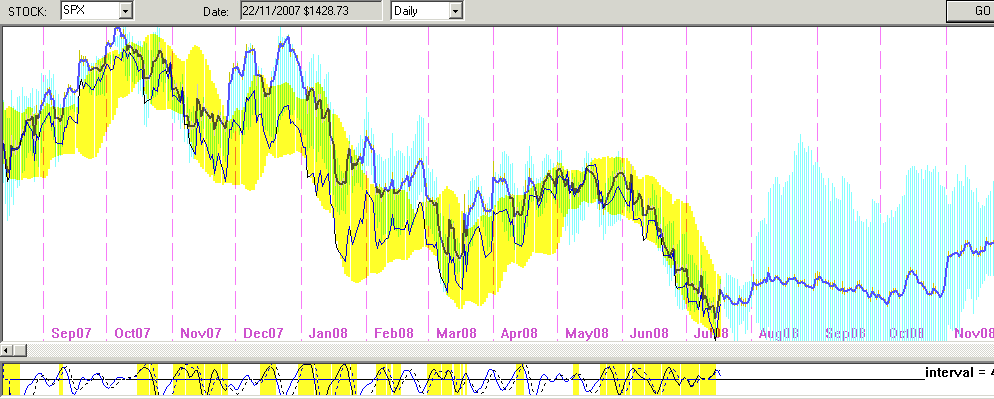
I'm looking more at the blue band rather than the blue line which shows both paths cancelling each other out.
There are of course many other potential paths it could take - these just seem like the best fit at the moment - but, as I keep saying, I have no idea.
(the yellow band on the historical data is a bollinger band)
more tea leaves


Add XJO (ASX) to my watchlist
 (20min delay) (20min delay)
|
|||||
|
Last
8,103.2 |
Change
-6.700(0.08%) |
Mkt cap ! n/a | |||
| Open | High | Low |
| 8,109.9 | 8,110.2 | 8,073.7 |
| XJO (ASX) Chart |