Great charts an stuff , thanks everyone.
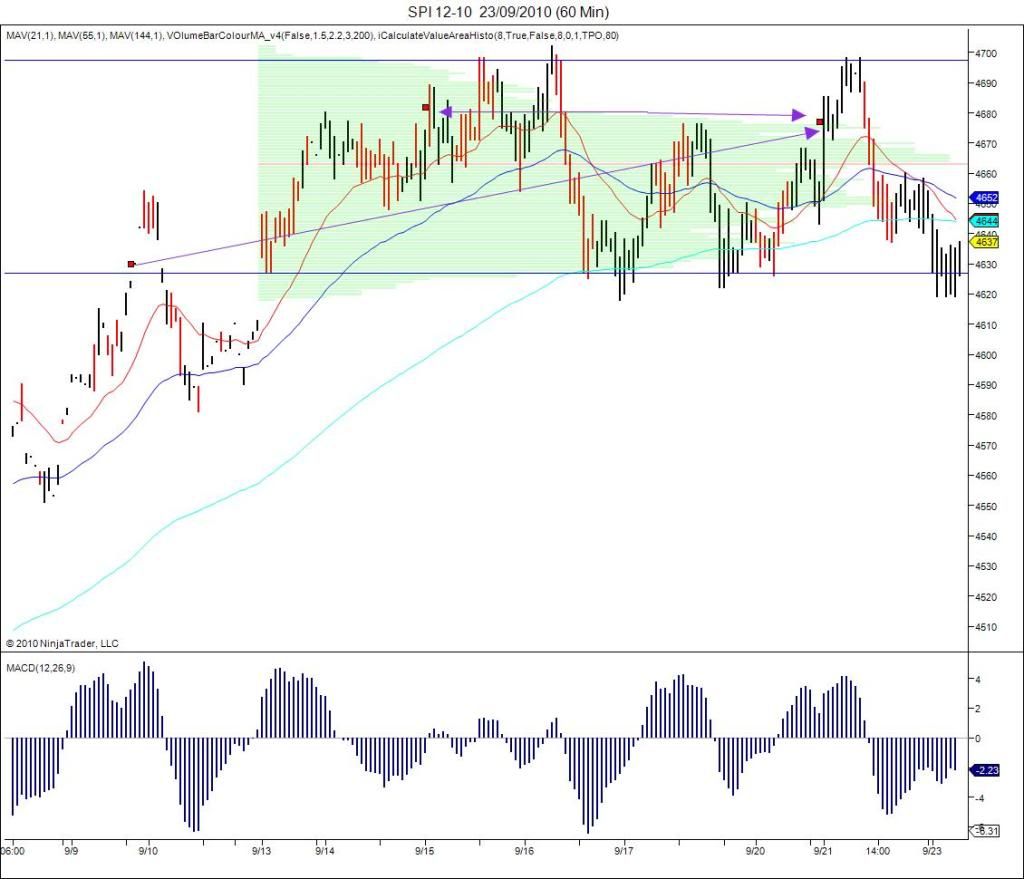
My read on the spi ..from the reference points I mentioned
( mine are a little different from the 3 day open bar closing price but it dosent matter )
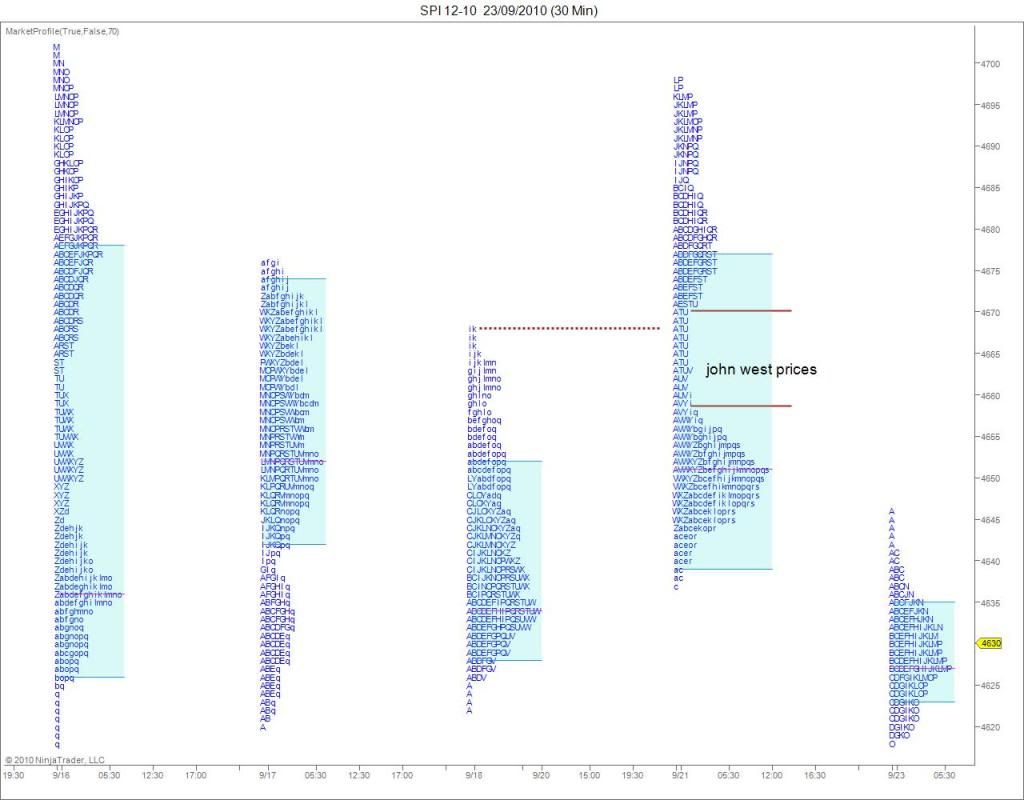
its clear to me that the condition of this market is sideways (horozontal) so the way I like to trade when the market is in that condition is to fade the recient lows and highs.I do thatt from the profile chart I have., and use the macd histo for a second reference.On that profile chart I marked prices that the market has reciently rejected , the john west prices I call em ..and that was a great place to fade the rally yesterday .
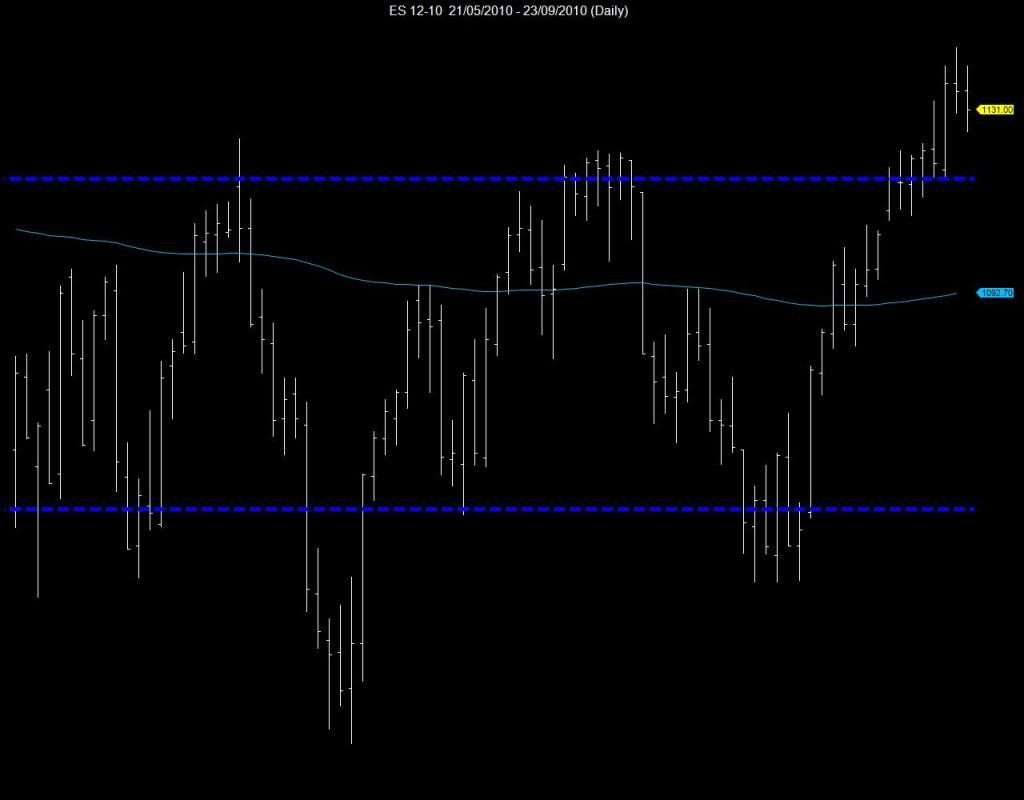
Sideways markets are great .as JD says trade in an out .We wait for a break and a more vertical phase . it will come sooner or later . I see on the leader emini on the way my time daily data is set up we have a swing top there , and I could be wrong but if we get another swing top its a great sell from the top of the long term trading bracket .
good luck and good trading to you .


- Forums
- ASX - By Stock
- new thread
Great charts an stuff , thanks everyone.My read on the spi...
-
- There are more pages in this discussion • 25 more messages in this thread...
You’re viewing a single post only. To view the entire thread just sign in or Join Now (FREE)
Featured News
Add XJO (ASX) to my watchlist
 (20min delay) (20min delay)
|
|||||
|
Last
7,953.2 |
Change
-36.400(0.46%) |
Mkt cap ! n/a | |||
| Open | High | Low |
| 7,989.6 | 7,989.6 | 7,894.3 |
Featured News
| XJO (ASX) Chart |
The Watchlist
MTL
MANTLE MINERALS LIMITED
Nick Poll, Executive Director
Nick Poll
Executive Director
SPONSORED BY The Market Online


