Could it be that we are about to see the mother of all bull markets break out ?? in the last 3.5 years we have seen an almighty fall followed by a short bounce followed by a very long consolidation period. Charting 101 suggests that the ascending triangle which has been building now for nigh on 2 years could be followed by an almighty breakout.
as for my fib dates they still aren't looking TOO bad and have served me well. My theoretical date for a low was Saturday May 21st and we hit a low on May 25th or 3 trading days later.
We have one more important date to survive. June 13th will be the Armstrong low and will be the US equivalent of our May 21st. Hopefully the next pink text I put on the chart below in a few months time will say "breakout"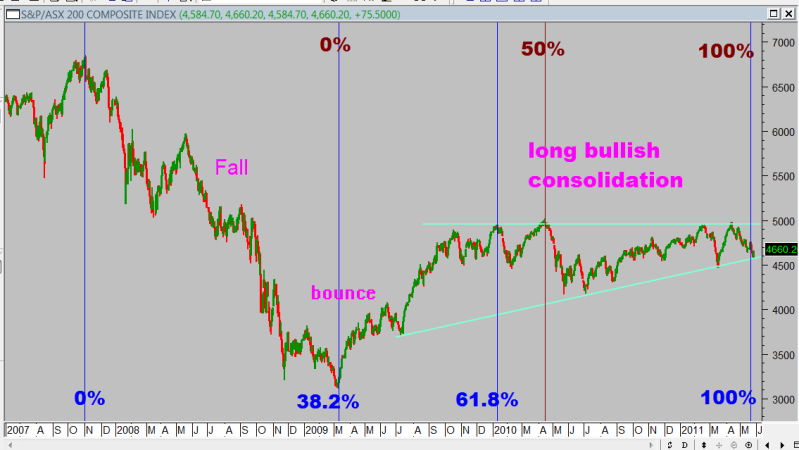


Add to My Watchlist
What is My Watchlist?
 (20min delay) (20min delay)
|
|||||
|
Last
8,668.2 |
Change
-89.000(1.02%) |
Mkt cap ! n/a | |||
| Open | High | Low |
| 8,757.1 | 8,757.1 | 8,648.4 |
| XJO (ASX) Chart |