G'day
Just had a look over the chart - for some time now it has demonstrated a very strong correlation to Fibonacci ratios. Some stocks trend towards these ratios stronger than others (and some not at all), though CVI seems to conform better than most.
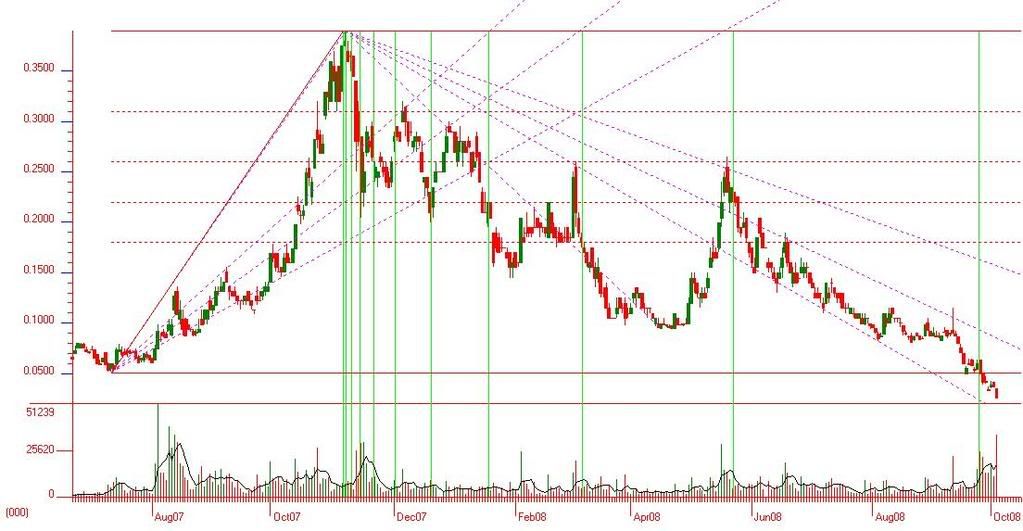
The chart below shows the various indicators that illustrate this phenomenon, using Fib retrace lines (red), Fib fan lines (pink) and Fib time series lines (green).
The price has trended within and stuck to the fan channels, using the retrace levels to mark minor and intermediate reversals, primarily around the time series intervals.
Does anyone here care to speculate as to whether the recent loss of the oil permits (I know nothing else about the company except that explained in the most recent announcement) will preclude CVI from continuing to trade according to Fib ratios? This failure appears to have been built into the SP by insiders (explaining the relatively minor SP fall), so one could argue that it can continue to trade by the same means as ever.
Is there a trade left in it?
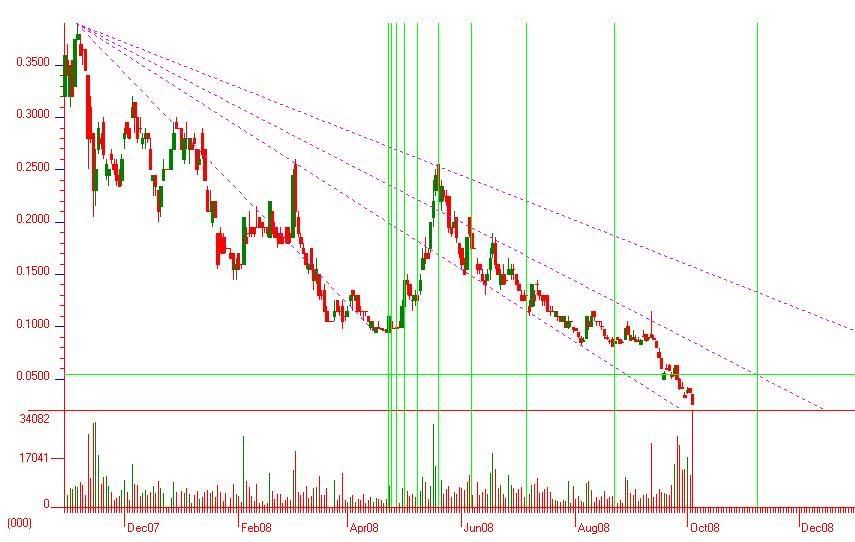
By applying the time series to the start of the last significant rally (late April), a confluence of the time series, the 50% upper limit fan line, and the long term support/resistance at 5.4c becomes apparent (see below). This last down trend has shown a propensity to trade within the 38.2% and 50% fan lines - could this mark a reasonable target of 5.5c around early November if a pullback occurs?
Interested to hear any opinions on the TA situation.
Cheers
not a bad week...not..., page-46
-
- There are more pages in this discussion • 29 more messages in this thread...


You’re viewing a single post only. To view the entire thread just sign in or Join Now (FREE)
Featured News
Add CVI (ASX) to my watchlist
Currently unlisted public company.
The Watchlist
LPM
LITHIUM PLUS MINERALS LTD.
Simon Kidston, Non--Executive Director
Simon Kidston
Non--Executive Director
SPONSORED BY The Market Online