Well, nice too see things werent bad in QLD as far as no lives reported lost as yet. May still be floods risk there, and elsewhere from Yasi, but comparisons of TC Tracy and Hurricane Katrina thankfully were overstated. May be a testament to the evacuation centres, and cyclone building standards that the damage is relatively minor.
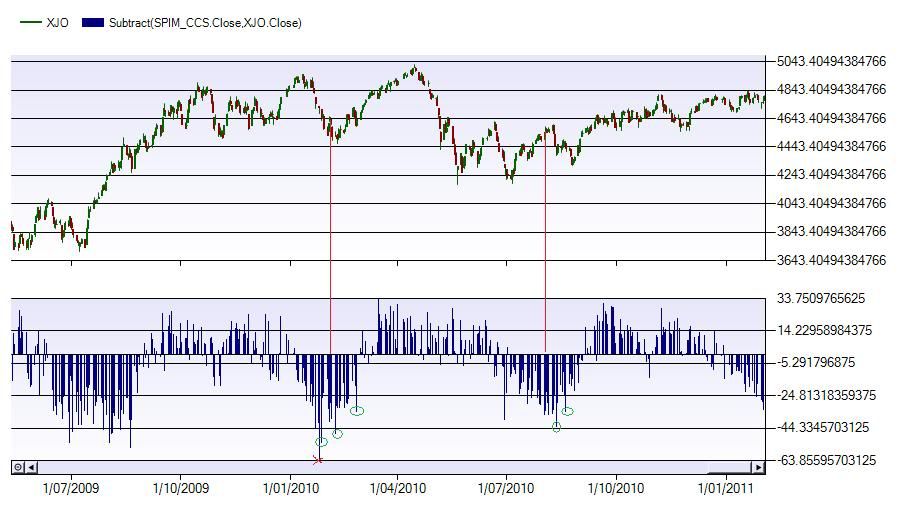
So, onto the markets, I was thinking a gap down today might be a nice long, but just weak directionless lead. I thought I should post the SPI prems chart as silverdice mentioned it yesterday, so a chart will put it into perspective...

So I marked the red lines at 3/2/10 and 3/8/10 for 6 and 12 months ago. As for the magnitude of the discounts, yesterdays 33.5 discount is actually quite normal and not what I'd call an outlier, as were at the bottom end of the cycle.
So, my observations would be that in the last 2 6-monthly lows of the SPI prem cycle, there was a minor low soon after on XJO. I put a little red cross on the Australia day low 2010, because SPI traded, but XJO did not, so we can disregard that days comparison. However the 27th Jan 2010 data had a discount of 53, 20 more points than yesterday. The timing suggests the low may be stretching out a bit in time, so perhaps still a minor low ahead, and from there any spikes (or outliers) down outside the normal cycle could be very good entry points for longs lasting weeks to 2 to 3 months.
Add to My Watchlist
What is My Watchlist?


