Might throw in a gold chart. The main difference with this one is I am using a log scale rather than the normal scale which highlights to me that the price of gold has not reached an extreme from the regression line shown and the parabolic nature of the trend also disappears. In fact it has been on a fairly consistent rise since '01.
Anyway, I would still be shorting gold rather than going long from this chart.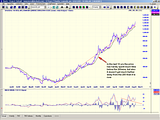
october 9 10 weekend, page-19
-
- There are more pages in this discussion • 93 more messages in this thread...


You’re viewing a single post only. To view the entire thread just sign in or Join Now (FREE)