Avenida Pardo 224, Of. 41 E-mail: [email protected]
Lima, Perú Website: www.lascoreport.com
Gold Update
The Real Scoop!
An awful lot is being said about gold today, probably too much. A quick glance at recent headlines reveals the following: the IMF is going to sell all its gold, the bull market in gold is over, the economy is great so who needs it, the Iraq issue was resolved with the recent election… The list just goes on and on. The item de jour is what happens to be on today's front page and, unfortunately, it couldn't be further from the truth. The price of gold is not moved by whatever dribble you hear on CNN. A real reflection of the demand for gold can't be found in any daily event or analysis. It's just not that simple. Gold prices, like any other market price, took into account today's headlines many months ago. Gold is forward looking and is now pricing into it things that will happen six or nine months from now. Unfortunately, we can't really know what that is but, then again, we don't have to.
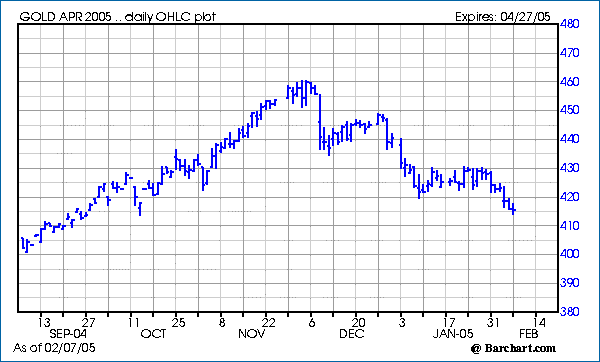
The following chart is a perfect example of modern day thought. It's a daily chart of the April gold futures contract and it doesn't paint a pretty picture, unless of course you happen to be bearish. You can plainly see that gold has been trending down since early
December with a series of lower highs and lower lows and a source of many sleepless nights if you're long gold. It's just the type of chart our "instant gratification" society likes and wants and given the recent price action, it's no surprise that investors have been heading for the door. Analysts are now calling for gold to move below $400.00 an ounce as they roll out their charts and numbers. Great stuff, except for one minor detail… they're wrong. The reasons for buying gold are just as true now as they were three years ago:
* An out of control fiscal deficit
* Declining gold production
* No easy solutions for the problems in the Middle East
* A huge and still growing trade deficit, and
* A non-productive U.S. economy based on debt and consumption
There are more reasons, but I think you get the idea. Furthermore these are problems that are ingrained in the very fabric of our everyday life and reinforced by a political machine that avoids the hard choices at all costs.
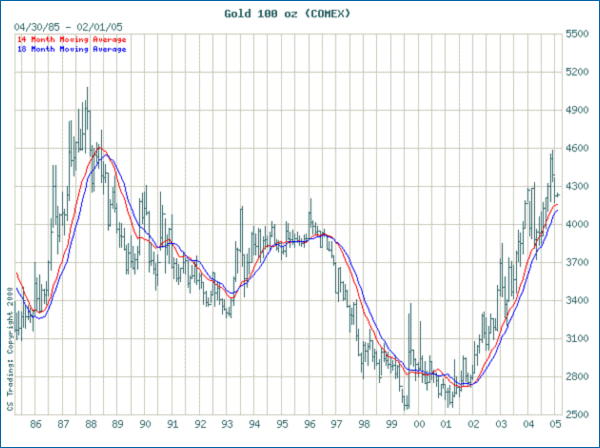
I hold an altogether different view of gold and it can best be pictured by feasting your eyes on the following chart:
This work of art is a monthly chart and is very seldom used by anyone other than an experienced investor and even an experienced investor is often guilty of not looking at this often enough. Take a look at gold's action from early 2001 to date. That, ladies and gentlemen, is what a real bull market looks like. My average client tends to focus on each and every one of the thirty parts that make up the individual vertical lines you see. That old adage of "not being able to see the forest for the trees" really applies here.
If we look close enough, we can find some interesting little tidbits of information in the monthly chart. For instance, the average down trend tends to wear itself out in the third month (we're in the third month) and a bottom is usually found somewhere just above or below the blue line. That blue line represents the 18-month moving average and has provided support for the Bull Market in gold for more than two years. In fact, there has only been one violation of the trend and that came during a correction that exhausted itself early in 2004. We weren't below it for very long though and it provided the foundation for a rally that lasted months and took gold from its $377.00/ounce low to a high of $460.00. Human nature being what it is though, we tend to remember the bad more than the good. There is a reason for that; fear is our strongest emotion. Currently, the 18-month moving average is at $413.00 and that's just $2.90 below Friday's close.
I contend that the monthly chart is the only way to go for a serious investor who is interested in taking advantage of the entire Bull Market. We can see that both averages are sloped up, the 14-month average is well above the 18-month average, and the price of gold is still above the 18-month average. In short, the market has been and continues to do what it should. What we are experiencing is nothing more and nothing less than a normal correction in both time and depth. In terms of percentage, our previous correction ran from $436.00 down to $377.00, a drop of $59.00 or 13.5%. So far, our current drop is only $45.00 and 9.80%. The market is still the same as it was before the correction began it's just a bad case of myopia that has us all unsettled.
In conclusion, gold is doing what it should and the only real inference to draw from our present market action is that we are somewhat oversold and, if the chart is true to form, we should be adding on somewhere in the very near future.
----------------------
Enrico Orlandini
Lasco Report
8 February 2005
...........................................................................
bye.dub
- Forums
- ASX - General
- on gold -- "the real scoop" -- it's good!
on gold -- "the real scoop" -- it's good!
Featured News
Featured News
The Watchlist
FBM
FUTURE BATTERY MINERALS LIMITED
Nick Rathjen, MD & CEO
Nick Rathjen
MD & CEO
Previous Video
Next Video
SPONSORED BY The Market Online


