Chart looks solid. Moving averages are rising, there is bullish crossover in MACD and Stochastic oscillator and RSI stands at 82.9. On watch for clear above 0.23.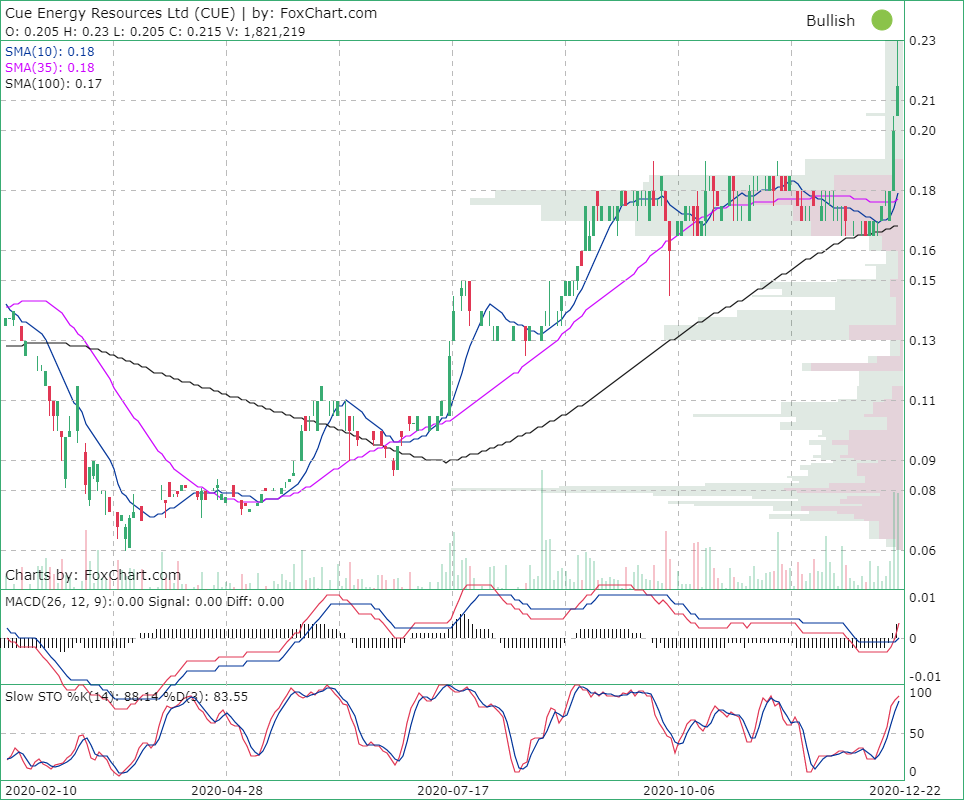
Chart looks solid. Moving averages are rising, there is bullish...


Add to My Watchlist
What is My Watchlist?
 (20min delay) (20min delay)
|
|||||
|
Last
11.5¢ |
Change
0.005(4.55%) |
Mkt cap ! $80.47M | |||
| Open | High | Low | Value | Volume |
| 11.5¢ | 11.5¢ | 11.0¢ | $11.23K | 98.53K |
Buyers (Bids)
| No. | Vol. | Price($) |
|---|---|---|
| 20 | 583020 | 11.0¢ |
Sellers (Offers)
| Price($) | Vol. | No. |
|---|---|---|
| 11.5¢ | 160290 | 1 |
View Market Depth
| Last trade - 12.42pm 12/09/2025 (20 minute delay) ? |
| CUE (ASX) Chart |