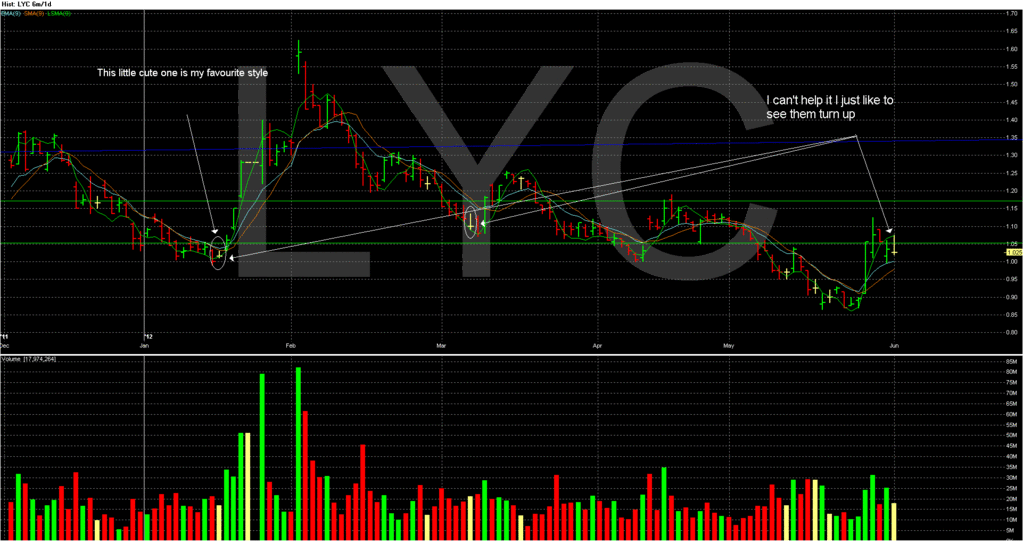
I thought about adding to Botfodders thread but he is such a sterling commentator on the intraday stuff I did not want to detract from his work with my ramblings. But here is the thing about the TA commentary Bots work makes me look even harder at my own analysis as does Adsy79’s and Mitta’s of course, sometimes I might not fully agree and sometimes I go shit why didn’t I see that, but it is always helpful that other chartists put up their work (sob, not only have we lost Mitta(temporary) but Timmo69 has dropped away as well (short data has lured him to the dark side), so come on you budding chartists (and you seasoned ones as well, you know who you are) give us some input and analysis, its starting to be a great charting stock (as apposed to a baiting and flaming point as it used to be) and it would help all the others interested in charting to see some opinions from a diversified crowd :)
Now off we go, the cat has been going crazy, I thought about sitting in the lotus position (as if I could do that), the house has been smudged and the prayer flags are out.
There was something about Fridays action that bugged me, I mean really bugged me I want to be all bullish now, I’m sick to death of bearish, but the charts, now you can look at his from many angles on any given day and read it differently and myself, I like to look at it from every angle possible which means I look from 1 minute all the way up to 120 minute bars on the intra day.
So I am looking at it and getting the same message every time bearish behaviour volume going up every time it goes down except at the close when it rose up, now it went up to 1.03 even with after market and then dropped to 1.25 on very little volume hmmmm high volume in the morning trailing off during the day, but very erratic on most time frames, and this is part of VSA it’s a picture of what is going on with relation to volume and spread, but even down to where in the bar the volume was, was it buying or selling and who the hell was doing what.
Now on the daily chart I saw my absolute favourite sign and I hope no one is offended, the upside down crucifix (although it was bigger than I like) and this often means switching from down to up (not always, only often, and not proven with a scientific study of either), It’s another mixed signal the fact that we started low went higher (too high) and finished low does not impress me
If I had to make a call it would be that we will go up on Monday but I am not confident about that call, volume compared to the last week was low on what to me in the daily chart looks like there was little supply to go down for if going down wont be productive then going up is the option, lets all hope because if they do decide to take it down they could take a lot of stops from the people that have bought into the recent rise, now I’m going to hide under the desk and wait for every one to start throwing rocks
And best if I don’t start on my opinion of the weekly chart, I think you all get enough of my opinion already.
- Forums
- Charts
- once more unto the breach
I thought about adding to Botfodders thread but he is such a...
-
- There are more pages in this discussion • 67 more messages in this thread...
You’re viewing a single post only. To view the entire thread just sign in or Join Now (FREE)
Featured News
Add LYC (ASX) to my watchlist
 (20min delay) (20min delay)
|
|||||
|
Last
$6.40 |
Change
0.000(0.00%) |
Mkt cap ! $5.982B | |||
| Open | High | Low | Value | Volume |
| $6.47 | $6.48 | $6.34 | $20.28M | 3.161M |
Buyers (Bids)
| No. | Vol. | Price($) |
|---|---|---|
| 1 | 12848 | $6.39 |
Sellers (Offers)
| Price($) | Vol. | No. |
|---|---|---|
| $6.40 | 17965 | 2 |
View Market Depth
| No. | Vol. | Price($) |
|---|---|---|
| 3 | 3600 | 6.360 |
| 1 | 15000 | 6.350 |
| 2 | 260 | 6.340 |
| 3 | 4563 | 6.330 |
| 4 | 8665 | 6.310 |
| Price($) | Vol. | No. |
|---|---|---|
| 6.400 | 10000 | 1 |
| 6.410 | 24000 | 1 |
| 6.420 | 203 | 1 |
| 6.450 | 3291 | 2 |
| 6.480 | 2100 | 2 |
| Last trade - 16.10pm 12/07/2024 (20 minute delay) ? |
Featured News
| LYC (ASX) Chart |


